1.0 Dashboard Basics
In this section, we'll take a look at basic access to the FileWave dashboard and give information on it's various built-in components. If you intend to use this dashboard, but you are new to it, then this is the place to start.
- 1.1 Accessing the FileWave Dashboard
- 1.2 Default Dashboard
- 1.3 FileWave Provided Dashboards
- 1.4 Switching Between Dashboards
- 1.5 Dashboard Panel/Widget Layout
- 1.6 Exposing an Association to Dashboard
- Importing a Grafana Dashboard
1.1 Accessing the FileWave Dashboard
What
Your account will need permission to access the FileWave Dashboard.
When/Why
There are three permission levels for the dashboard for each admin logon:
- No Access
- Read-Only Access
- Read-Write Access
The permissions are defined with the following options in the Manage Administrators Assistant:

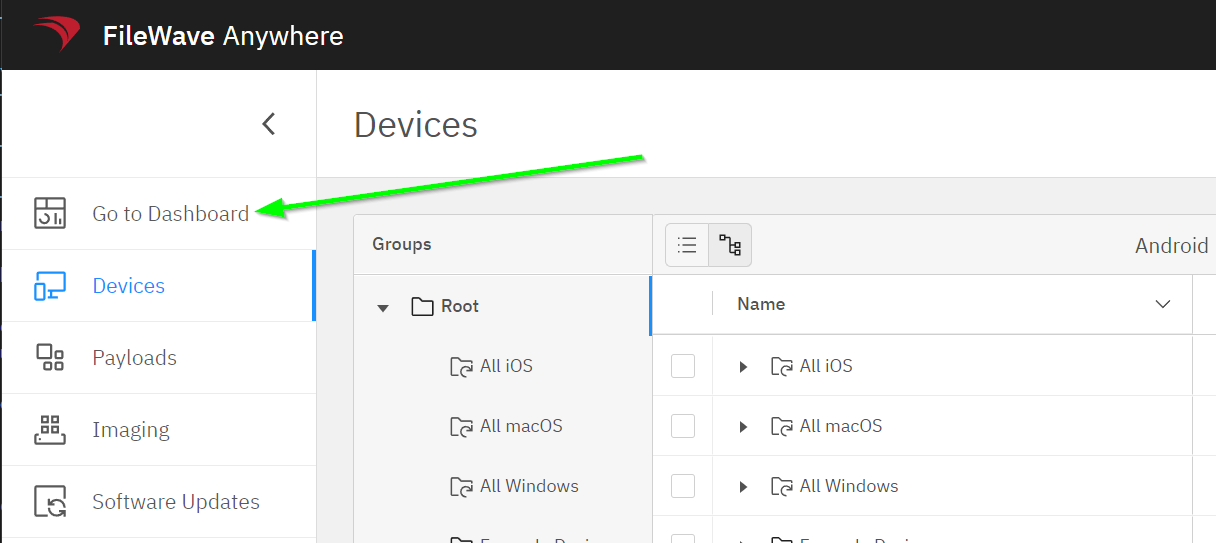
How
Accessing the dashboard itself is quite simple once your account has proper permissions. From the WebAdmin, simply choose the Go To Dashboard link:

You will automatically be authenticated using the already established credentials to the WebAdmin. Note that all access to the dashboard is routed through the WebAdmin
1.2 Default Dashboard
What
When you open the dashboard, FileWave shows the default system dashboard:

When/Why
The default dashboard, FileWave System, gives you a quick health view of core FileWave services and configuration items. Green widgets indicate healthy or configured items, while red widgets point to items that need attention.
How
Resolve the underlying issue to clear the dashboard warning. In the example above, the dep widget is red because no macOS client is specified for use by DEP. After you upload the pre-configured client, the widget should turn green.
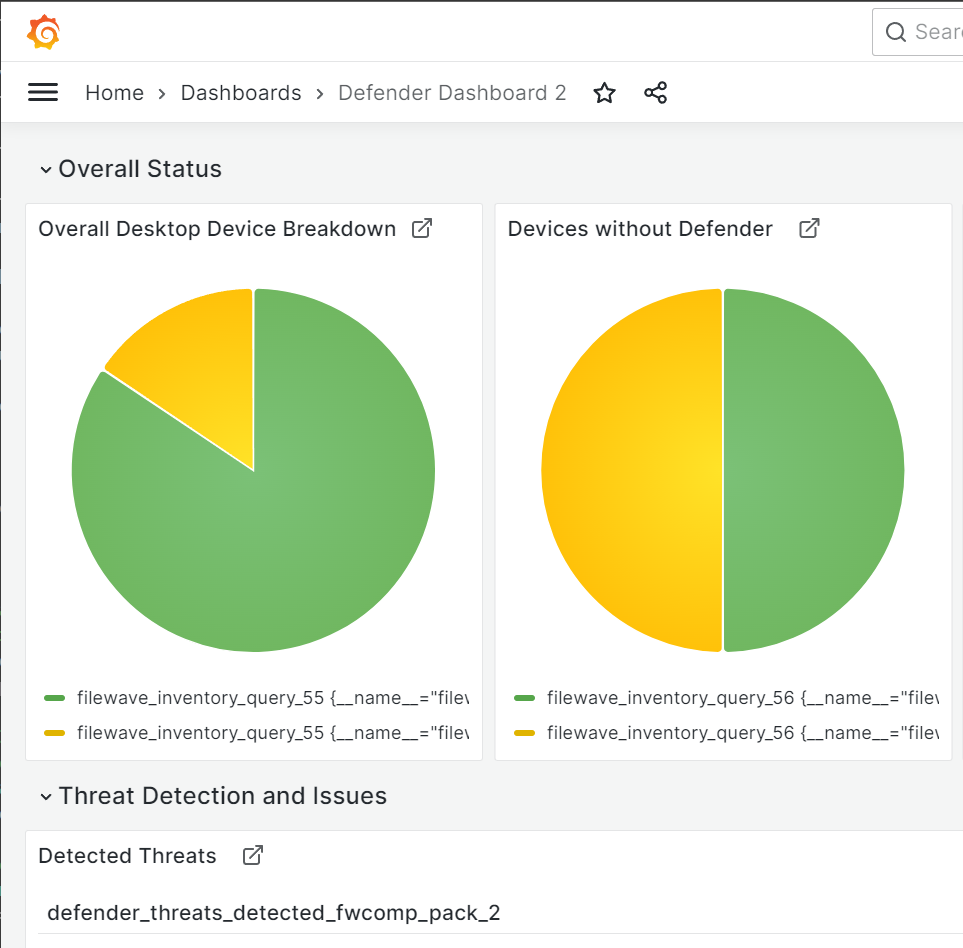
1.3 FileWave Provided Dashboards
What
FileWave includes several default dashboards. Some are useful for day-to-day admin checks, while others give FileWave Support a faster view into system health.
When/Why
Use these dashboards as reporting examples and starting points. They show common ways to organize FileWave system, configuration, patching, application, and deployment status data.

How
FileWave-provided dashboards are templates. You cannot edit them directly, but you can copy them and then adjust the panels, filters, transformations, and layout for your own reporting needs.
1.4 Switching Between Dashboards
What
Use dashboards to move between FileWave data views after you log in.
When/Why
Different dashboards show different slices of FileWave data. You can open dashboards in separate browser tabs, switch views in one tab, or use a playlist to cycle through dashboards automatically.
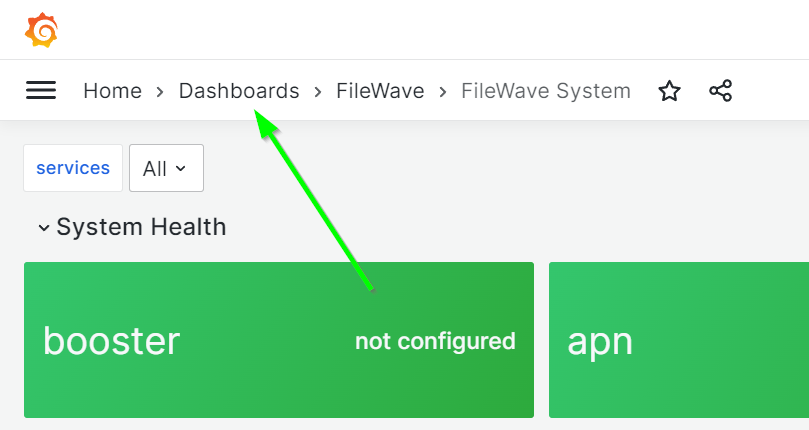
How
For basic switching, use the dashboard links in the header as shown below:
You can also use Dashboards > Manage to browse dashboard folders, playlists, snapshots, and dashboard management actions:

1.5 Dashboard Panel/Widget Layout
What
Dashboard panels/widgets can be moved and resized so the dashboard shows the most useful information first.
When/Why
After you copy or add dashboard content, adjust the layout so related panels sit together and high-priority panels are easy to see.
How
Drag a panel/widget to move it. Use the panel edge or corner handles to resize it, as shown in the video below:
1.6 Exposing an Association to Dashboard
What
FileWave can expose an association to the Dashboard so deployment progress is visible as a Dashboard widget.
When/Why
Use this when a rollout is important enough that administrators or other stakeholders need a quick progress view. It is most useful for larger deployments, client upgrades, or staged rollouts where completion, remaining devices, warnings, and errors need to be watched without opening the association every time.
How
- Open the association you want to track.
- On the association options, enable Expose to Dashboard.
- Save the association and confirm the change through your normal FileWave workflow.
- Open the Dashboard and review the association progress widget.
The exact surrounding labels may vary by FileWave version, but the association option is shown below.

After the change is active and clients report status, the Dashboard shows progress for the exposed association.

Related content
Importing a Grafana Dashboard
What
If another FileWave environment already has a useful Grafana dashboard, you can import its dashboard JSON instead of building the dashboard again from scratch.
When/Why
Import a dashboard when you have a trusted dashboard export from another system and want to reuse the same layout, panels, and queries.
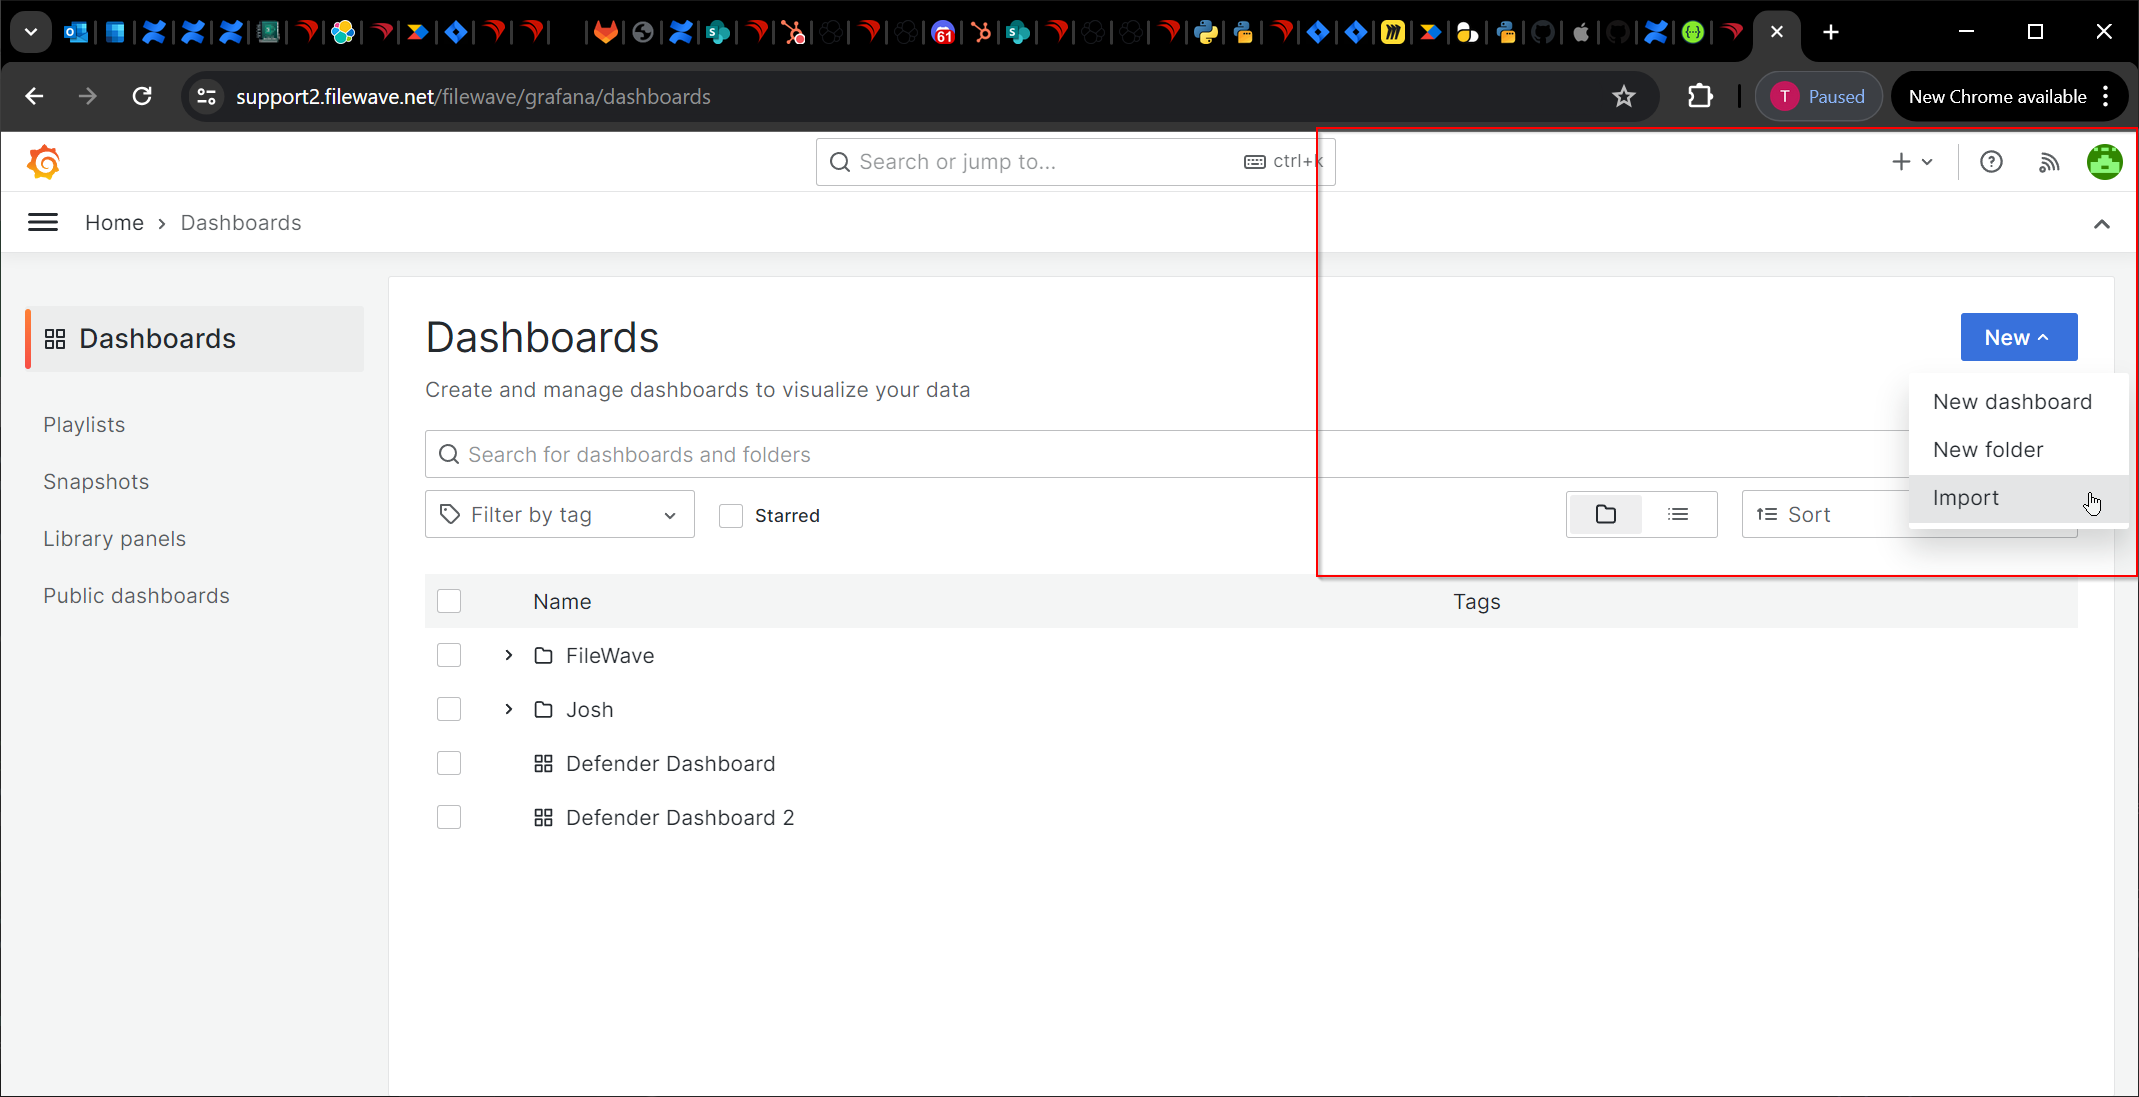
How
From FileWave Anywhere, open Dashboard:
In Grafana, open Home > Dashboards:
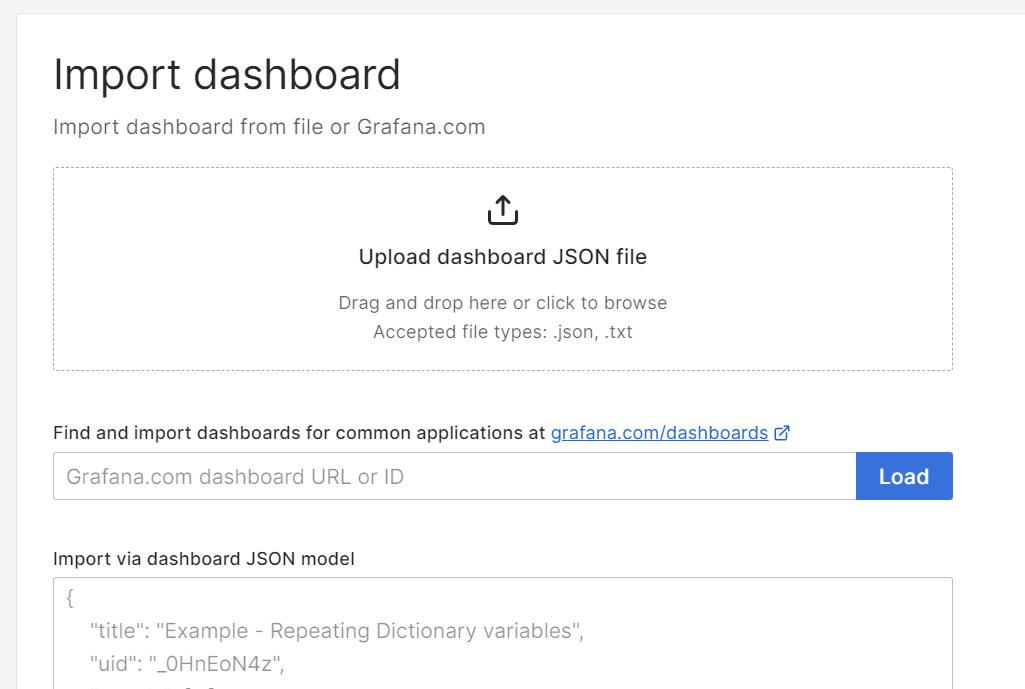
Select New, then Import:
Import the JSON file or paste the exported JSON content:
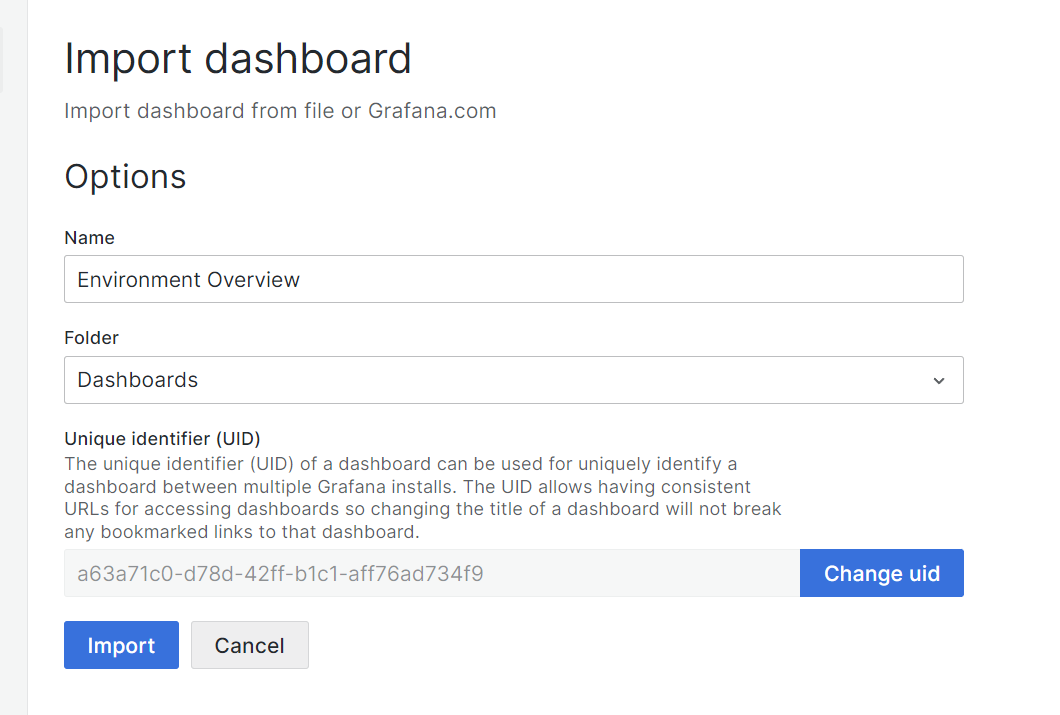
Set a dashboard name and destination. Each Grafana dashboard must have a unique UID:
The dashboard is now imported: