2.0 Custom Dashboards for Beginners
Once you get the hang of the elements that are provided for you automatically, you may want to take the next step and start creating custom dashboards of your own.
FileWave supplied dashboards will only take you just so far. As soon as you want to know specific information about your environment and your deployments you are going to want to create your own dashboards with your own dashboard elements.
The contents for customization are broken into two parts. In the first (this section) we'll look at the components of dashboards and show you how you can build your own simple custom dashboards. In the next section, we'll get much more detailed and advanced.
- Using Grafana for Data Aggregation
- 2.1 Creating Your Own Dashboard
- 2.2 Copying Widgets (Panels)
- 2.2.1 Copied Panel is Blank
- 2.3 Widget/Panel Elements
- 2.4 Creating a New Panel (existing data)
Using Grafana for Data Aggregation
What
Grafana dashboards in FileWave can aggregate report data, such as grouping devices by FileWave Client version or counting devices missing each patch. This article shows how to build an aggregated visualization from a FileWave report.
When/Why
Use data aggregation when a dashboard should show counts or grouped totals instead of a raw list of devices. For example, you might create a report of devices missing OS patches, group the results by patch name, and count the devices missing each patch for a bar or pie chart.
How
Start with a FileWave report that returns only the fields you want to chart. In this example, the report shows the FileWave Client version for macOS and Windows devices:
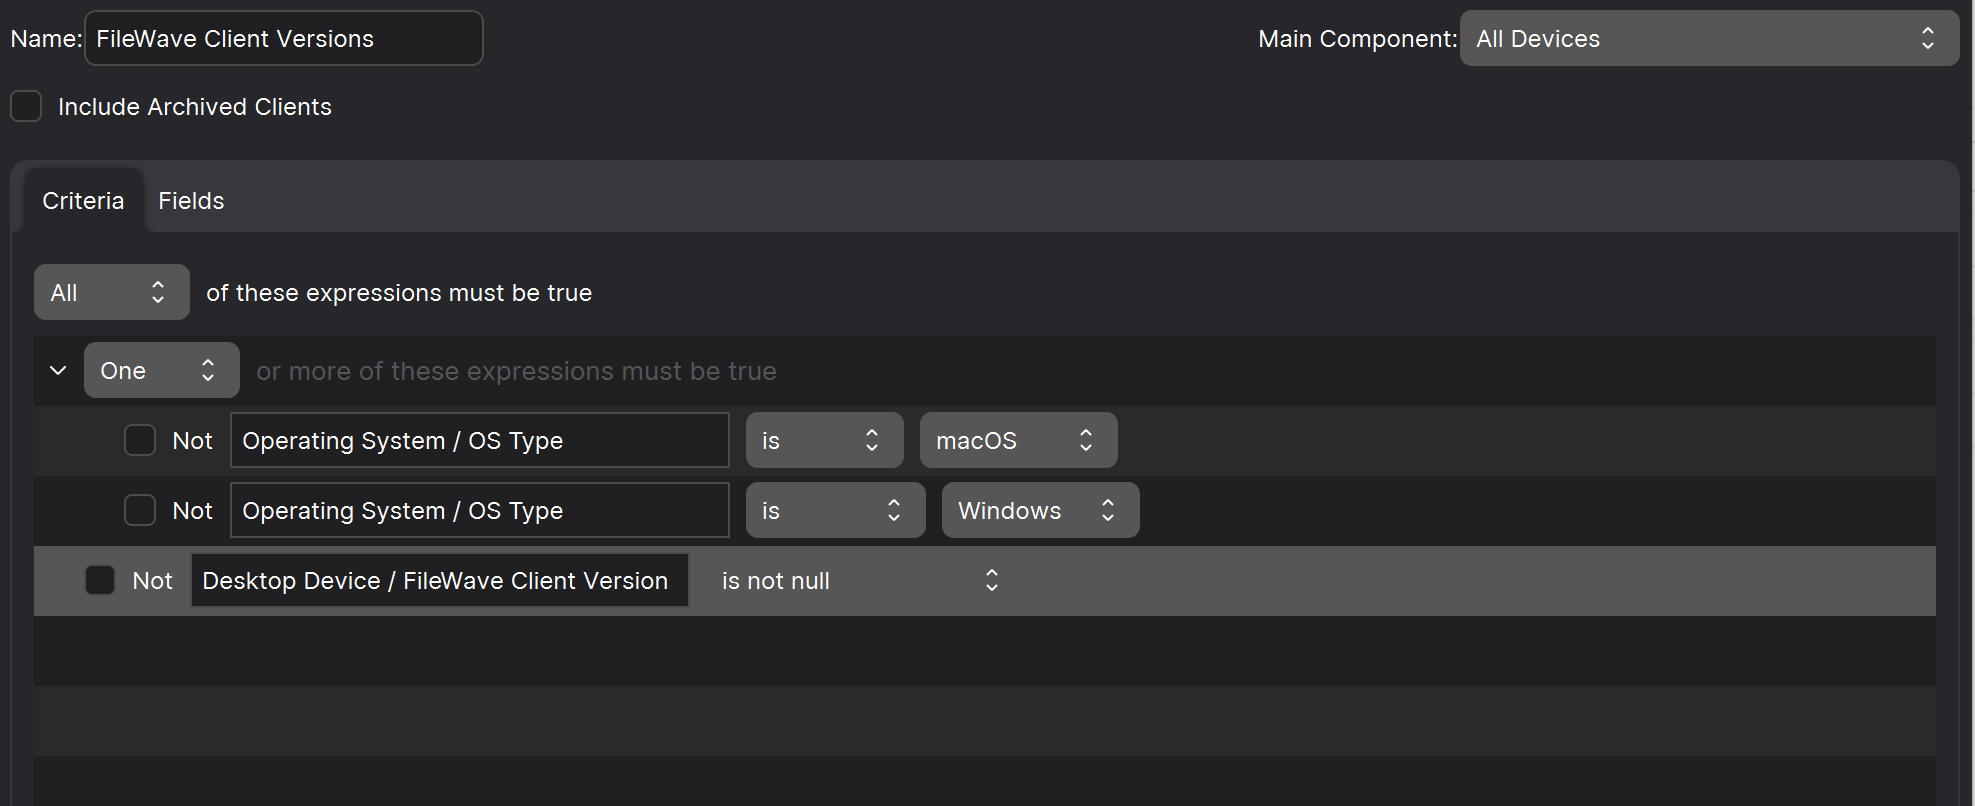
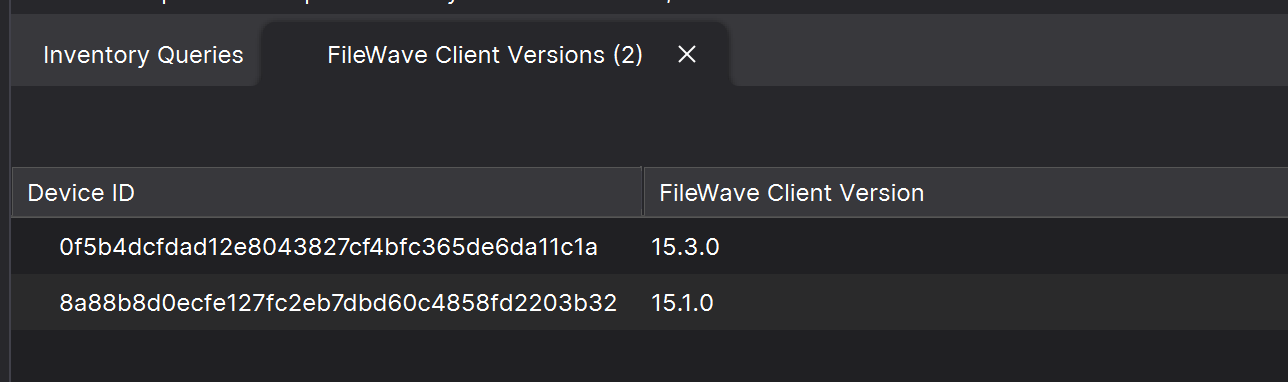
The report filters out blank client-version values so the dashboard does not count empty placeholders. It includes two fields: FileWave Client Version, which will be grouped, and Device ID, which will be counted. This small test system produces a short result set:
Open Dashboard from FileWave Anywhere, then follow the video to create the aggregated visualization:
Related content
2.1 Creating Your Own Dashboard
What
FileWave dashboards can be customized. You can start with the included dashboards, then build your own views for the data your team checks most often.
When/Why
Dashboard elements, also called widgets, can be combined into custom dashboards. You can copy widgets from existing FileWave dashboards or create new widgets directly.
How
This example creates a new empty dashboard. It starts with a folder because most environments eventually have more than one custom dashboard. After creating the dashboard, use the related copying-widgets article to add content to it.
2.2 Copying Widgets (Panels)
What
Copy an existing Grafana panel, called a widget in this KB series, when another dashboard already has the view you need.
When/Why
This is useful when a panel already has the right query, visualization, or layout and you want to reuse it in a custom dashboard instead of rebuilding it. The video below copies panels from existing dashboards into a new custom dashboard.
How
Copying existing dashboard content is a normal Grafana workflow: copy the panel, paste it into the target dashboard, adjust it if needed, and repeat for the next panel.
|
If you find that your copied panel is blank, take a look at resolving that in this article: Fixing Blank Copied Panel |
2.2.1 Copied Panel is Blank
What
If a copied dashboard panel is blank, recreate the variables that the panel expects in the destination dashboard, then save the dashboard and reload the panel.
When/Why
This most often happens when the source dashboard has variables that the panel depends on, but the destination dashboard does not. For example, if a panel relies on $host for the server address and the destination dashboard does not define $host, the panel can paste successfully but render blank.
How
Below you'll see the issue:
Fixing the issue requires recreating the variables in the destination dashboard. Grafana does not copy those variables with the panel, so recreate them manually. In any dashboard, open Dashboard Settings → Variables to review the variables:
 then
then 
Recreate the same variable names and values in your destination dashboard:

After saving the variables, reload the dashboard. The copied panel should now render with data:

2.3 Widget/Panel Elements
What
All panels (or widgets) on the FileWave dashboard are comprised of the same basic elements. This article reviews those elements at a high level.
When/Why
If you are using pre-existing panels, you won't care too much about how they are built. However, as soon as you want to build your own panels, the building blocks become quite important.
How
All panels have the following three elements:
- The Query (Choosing what data you want to see in the panel)
- The Visualization (Choosing the visual representation of the data: gauge, bar chart, table...)
- General (Panel properties such as title, comment, links)
In the below you'll see examples of each of these elements:
|
The Query |
|
|
|
The query you choose defines the data provided to the panel. In this case, an inventory query was selected. |

|
The Visualization |
|
|
|
Because we chose an inventory query as our data source, a table was our only possible visualization. In our more advanced example though, you'll see that we can do charts and graphs here of all sorts. |

|
General |
|
|
|
We only specified a name in this case for this panel, but it is very useful to also set a link for the panel to tie directly into a report in the webadmin. |

2.4 Creating a New Panel (existing data)
What
Dashboard panels can use existing FileWave Inventory Reports (formerly Queries) as their data source. The panel uses the report rows directly, so this method is best for table panels and does not aggregate values.
When/Why
Use this when a report already shows the device or inventory data you want to share on a dashboard, such as a list of macOS clients. The dashboard panel gives that report a shared Grafana view without rebuilding the report logic.
How
When creating the panel, choose FileWave Tabular Datasource for the panel query. FileWave makes Inventory Reports available automatically through that datasource. The walkthrough below shows a table-based panel built from a report that lists macOS clients.