# 2.0 Custom Dashboards for Beginners

Once you get the hang of the elements that are provided for you automatically, you may want to take the next step and start creating custom dashboards of your own.  
  
FileWave supplied dashboards will only take you just so far. As soon as you want to know specific information about your environment and your deployments you are going to want to create your own dashboards with your own dashboard elements.  
  
The contents for customization are broken into two parts. In the first (this section) we'll look at the components of dashboards and show you how you can build your own simple custom dashboards. In the next section, we'll get much more detailed and advanced.

# Using Grafana for Data Aggregation

## What

Grafana has been included within FileWave for quite some time, but only with a recent update does Grafana have the ability to do data aggregation without using Prometheus. This article shows you how to use this feature.

## When/Why

We'll use Data Aggregation whenever we want to look at an overview of data. For instance, if we want to understand how many devices are missing OS patches, we might create a report showing all devices, and their missing patches. To give a graphical representation of this, we would likely ***Group*** this data by patch name, and ***Count*** the number of devices missing each. This data is perfect for a visualization like a bar or pie chart.

## How

To create an aggregated visualization, we need to start with a report in FileWave. In this instance, we'll create a report on the version of the FileWave client on Mac and Windows devices:

[![image.png](https://kb.filewave.com/uploads/images/gallery/2024-03/scaled-1680-/NijqHxZO6vGx9DKC-image.png)](https://kb.filewave.com/uploads/images/gallery/2024-03/NijqHxZO6vGx9DKC-image.png)

Note that we included that the client versions is not null...this prevents having placeholders, etc in the data. Also note that we only included two fields here: FileWave Client Version (which we intend to Group By), and Device ID (which we intend to count). There aren't may devices in this system, so the data just looks like this:

[![image.png](https://kb.filewave.com/uploads/images/gallery/2024-03/scaled-1680-/QkQuVExR2U9XLqH8-image.png)](https://kb.filewave.com/uploads/images/gallery/2024-03/QkQuVExR2U9XLqH8-image.png)

Now we are ready for the "dashboard" part of the exercise, so go into your Dashboard from FileWave Anywhere and follow along with this short video:

<video class=" align-center" controls="controls" height="386" src="https://kb.filewave.com/attachments/318?open=true" style="width: 687px; height: 386px;" width="687"></video>

<span style="color: rgb(34, 34, 34); font-family: var(--font-heading); font-size: 2.2em; font-weight: 400;">  
Related Content</span>

- [Dashboard (Grafana)](https://kb.filewave.com/books/dashboard-grafana "Dashboard (Grafana)")
- [Content Packs](https://kb.filewave.com/books/content-packs "Content Packs")

# 2.1 Creating Your Own Dashboard

## What

FileWave dashboards can be customized. You can start with the included dashboards, then build your own views for the data your team checks most often.

## When/Why

Dashboard elements, also called widgets, can be combined into custom dashboards. You can copy widgets from existing FileWave dashboards or create new widgets directly.

## How

This example creates a new empty dashboard. It starts with a folder because most environments eventually have more than one custom dashboard. After creating the dashboard, use the related copying-widgets article to add content to it.

<video controls="controls" height="300" width="600"><source src="https://kb.filewave.com/attachments/57"></source></video>

# 2.2 Copying Widgets (Panels)

## What

If we have the power to create our own dashboards, then surely we must be able to add content to them...

## When/Why

We are going to copy a widget (referred to as a panel in Grafana) whenever one already exists and we can leverage it without doing any extra work. For instance, watch below, as we "steal" content from various pre-existing dashboards for our own custom dashboard.

## How

Taking pre-existing content from other dashboards is as easy a copy and paste (rinse and repeat):

<video controls="controls" height="300" width="600"><source src="https://kb.filewave.com/attachments/58"></source></video>

<table id="bkmrk-if-you-find-that-you"><tbody><tr><td>If you find that your copied panel is blank, take a look at resolving that in this article: [Fixing Blank Copied Panel](https://kb.filewave.com/books/dashboard-grafana/page/221-copied-panel-is-blank "2.2.1 Copied Panel is Blank")

</td></tr></tbody></table>

# 2.2.1 Copied Panel is Blank

## What

In certain circumstances, when you copy/paste a panel into another dashboard, you may find that the new panel is blank.

## When/Why

This will happen most often if the dashboard that you copied from has variables defined that the panel relies upon. For instance, if a panel relies on $host to be the address of your server, but the destination dashboard doesn't have that variable, then the panel will copy, but be blank.

## How

Below you'll see the issue:

<video controls="controls" height="300" width="600"><source src="https://kb.filewave.com/attachments/59"></source></video>

Fixing the issue requires replicating the variables in the destination dashboard. (Unfortunately there is no method for copy/paste, so they must be regenerated.). In any dashboard, you can see the variables in Dashboard Settings → Variables:

![](https://kb.filewave.com/uploads/images/gallery/2023-07/ydmFVFgDah0wPdjJ-embedded-image-lyq5d0tm.png) then ![](https://kb.filewave.com/uploads/images/gallery/2023-07/nV7c16QJqaII1fTj-embedded-image-d1wjtszv.png)

Replicate the variables in your own dashboard:

![](https://kb.filewave.com/uploads/images/gallery/2023-07/xq4ECGcgB011M9oD-embedded-image-ffjlyvlt.png)

And, once you save those new variables, you should find your copied panel now works:

![](https://kb.filewave.com/uploads/images/gallery/2023-07/syhZ3XwlYf2iaU33-embedded-image-jjr4maez.png)

# 2.3 Widget/Panel Elements

## What

All panels (or widgets) on the FileWave dashboard are comprised of the same basic elements. This article reviews those elements at a high level.

## When/Why

If you are using pre-existing panels, you won't care too much about how they are built. However, as soon as you want to build your own panels, the building blocks become quite important.

## How

All panels have the following three elements:

- The Query (Choosing what data you want to see in the panel)
- The Visualization (Choosing the visual representation of the data: gauge, bar chart, table...)
- General (Panel properties such as title, comment, links)

In the below you'll see examples of each of these elements:

<table id="bkmrk-the-query-the-visual"><tbody><tr><td>The Query

</td></tr><tr><td>![](https://kb.filewave.com/uploads/images/gallery/2023-07/VTUwLKmE0O6wsypu-embedded-image-wl36jnfs.png)

</td></tr><tr><td>
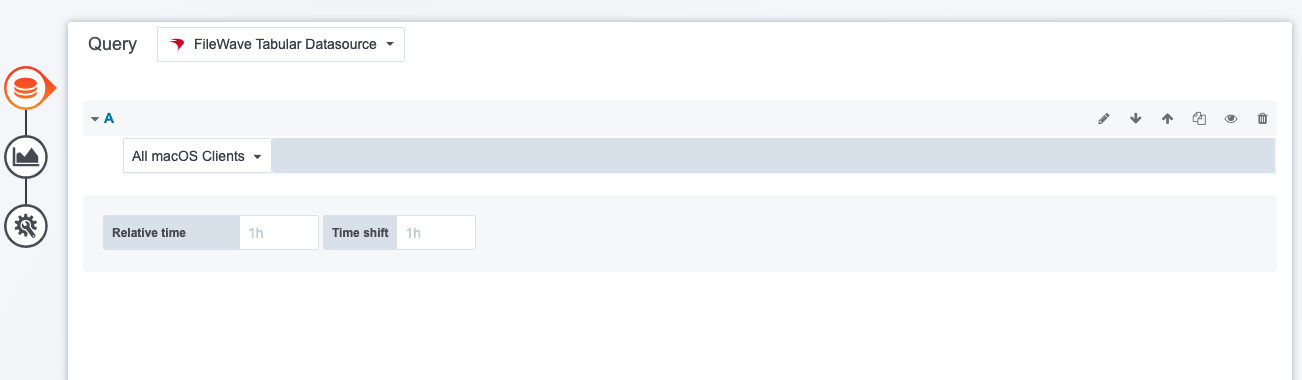
The query you choose defines the data provided to the panel. In this case, an inventory query was selected.

</td></tr></tbody></table>

<table id="bkmrk-the-visualization-be" style="width: 100%; height: 341.664px;"><tbody><tr style="height: 35.3984px;"><td style="width: 100%; height: 35.3984px;">The Visualization

</td></tr><tr style="height: 203.672px;"><td style="width: 100%; height: 203.672px;">![](https://kb.filewave.com/uploads/images/gallery/2023-07/OsBbzUaz6X14ZrvI-embedded-image-c4o3g03g.png)

</td></tr><tr style="height: 102.594px;"><td style="width: 100%; height: 102.594px;">
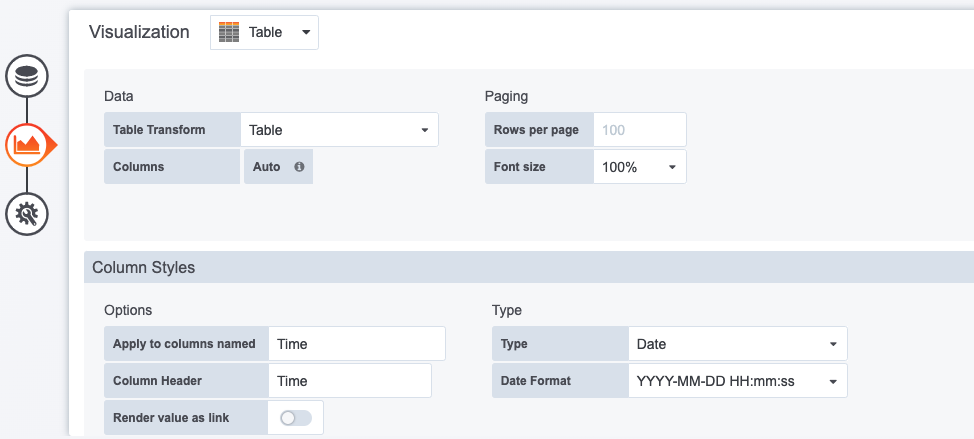
Because we chose an inventory query as our data source, a table was our only possible visualization. In our more advanced example though, you'll see that we can do charts and graphs here of all sorts.

</td></tr></tbody></table>

<table id="bkmrk-general-we-only-spec"><tbody><tr><td>General

</td></tr><tr><td>![](https://kb.filewave.com/uploads/images/gallery/2023-07/p8PIE52FsNxw9Bsa-embedded-image-nmjxglpu.png)

</td></tr><tr><td>
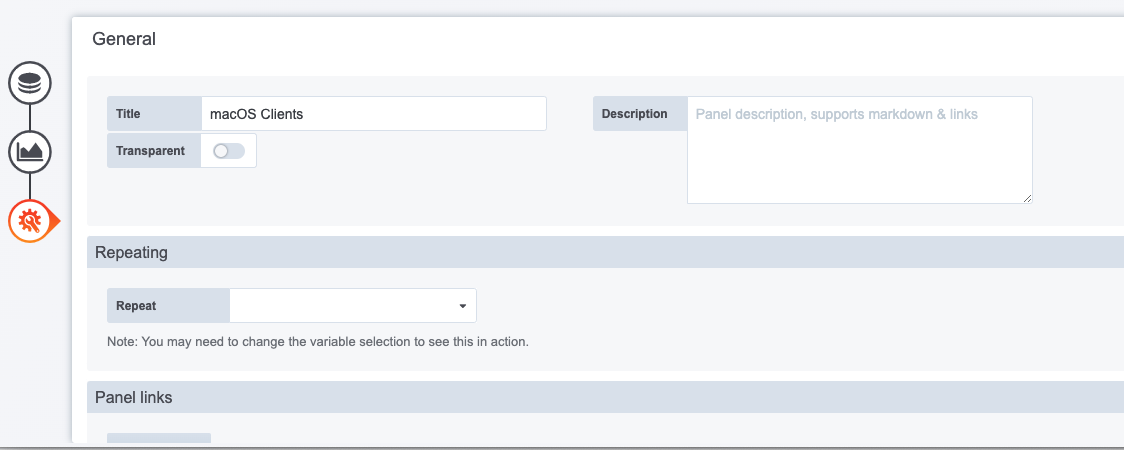
We only specified a name in this case for this panel, but it is very useful to also set a link for the panel to tie directly into a report in the webadmin.

</td></tr></tbody></table>

# 2.4 Creating a New Panel (existing data)

## What

It is possible in the FileWave dashboard to add panels directly from an inventory query (report) with some limitations (no data aggregation).

## When/Why

The data panels are simple enough to add as you'll see below, but the only representation available for them is a table format, which is the equivalent of the report/inventory query itself, but in the dashboard, so easier to share.

## How

All Inventory Queries (reports) are available automatically when you choose FileWave Tabular Datasource for your panel's query. See a quick walkthrough below of creating a new table based panel to show all macOS clients:

<video controls="controls" height="300" width="600"><source src="https://kb.filewave.com/attachments/60"></source></video>