# 4.0 Dashboard Alerts
With the Custom Dashboards configured you can now choose to configure email alerts based upon conditions met. Alerts are only available for Visualisations of type Graph.
Custom Dashboards provide live information, but for some you will want to receive notifications when certain criteria has been reached. Two elements require configuring, email and the alert itself: Email and Alert
# 4.1 Grafana Email Configuration
## What
Use this process to configure email in Grafana so alert notifications can be sent by email.
## When/Why
Configure email before you create or test alert notifications.
## How
Edit the Grafana configuration file on the FileWave Server:
| /usr/local/etc/filewave/grafana/conf/filewave.ini
|
Add or update the `[smtp]` section with your mail server details. Set `enabled = true` so Grafana can actually send mail. If your mail relay requires client certificate authentication, you can also set `cert_file` and `key_file`.
```shell
[smtp]
enabled = true
host = smtp.example.com:587
user = smtp-user
# If the password contains # or ; wrap it in triple quotes, for example """#password;"""
password = """smtp-password"""
cert_file =
key_file =
skip_verify = false
from_address = alerts@example.com
from_name = FileWave Grafana
ehlo_identity =
```
Leave the existing FileWave-specific settings in place, and only change the SMTP values you need. If your relay does not use client certificates, leave `cert_file` and `key_file` empty.
For the full list of available SMTP options, see [Grafana's configuration documentation](https://grafana.com/docs/grafana/latest/administration/configuration/#smtp).
After saving the file, restart the FileWave Server so Grafana reloads the configuration:
| sudo fwcontrol server restart
|
Then open Grafana, go to the Alerting section, choose **Contact points**, create or edit an Email contact point, and send a test notification.
# 4.2 Grafana Alert Configuration
## What
Set up Alerts for those times you want to be notified.
Alerts are only available for Visualisations of type Graph
## When/Why
Leverage your Web Admin Custom Dashboard elements to build Alerts.
## How
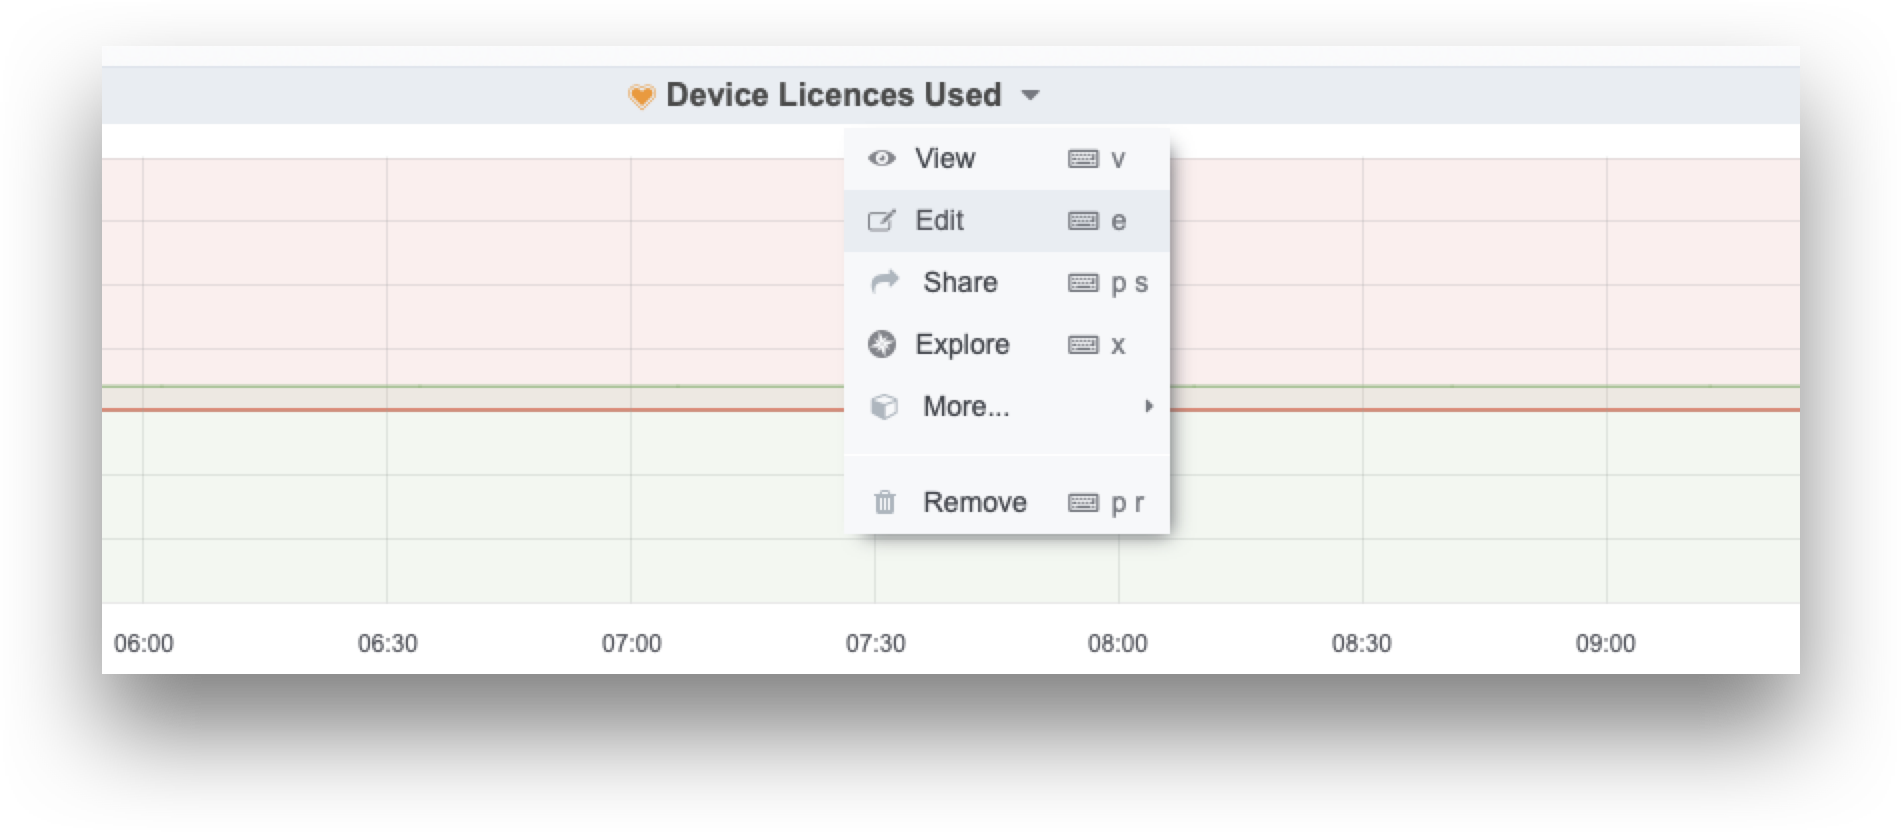
Select your chosen Graph and from the drop down choose 'Edit':
Select the Notification icon and configure the conditions as desired. In this example if the total device count exceeds 20 devices, a notification will be triggered.
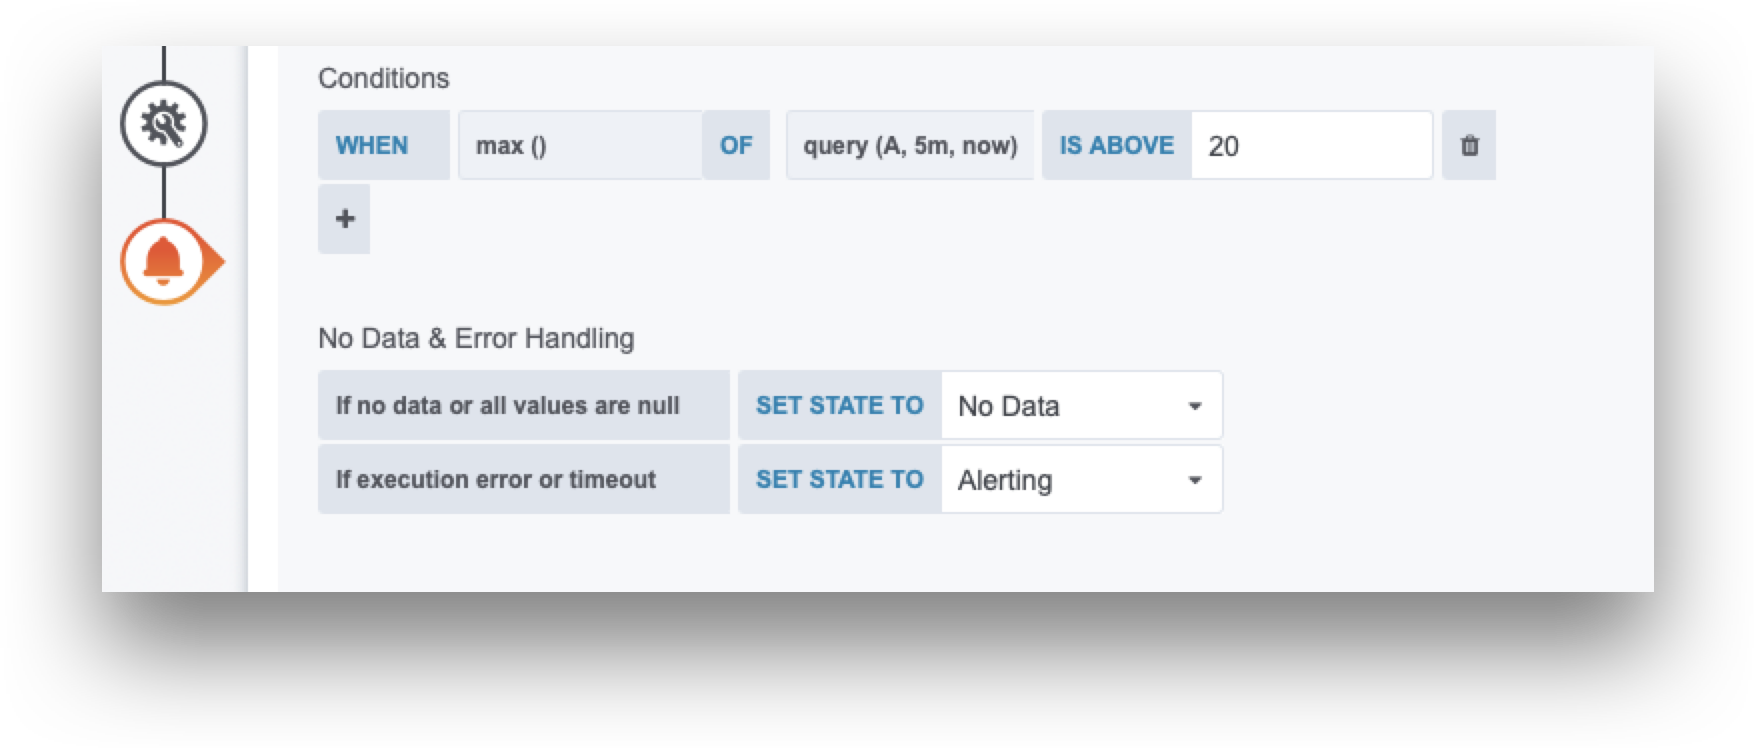
Add any message as you see fit.