# Dashboard (Grafana)

The FileWave dashboard is a collection of custom code and open-source solutions. We'll give you the beginner's guide here for customizing your dashboard up to some more advanced topics.

# FileWave Dashboard Intro

## What

The FileWave Dashboard provides summary information about your FileWave server, your deployments, and pretty much anything else you'd like to know about your FileWave environment.

## When/Why

The best time to use the dashboard is when summary data is important to you, particularly regarding server performance and deployment progress. It is a great tool to communicate with senior management, or to simply keep a watchful eye on your environment.

## How

We won't go into detail in this article about using the Dashboard, but we will do that in all of the great articles in this section of the KB. That said, the FileWave dashboard is a collection of custom code and open-source solutions. We'll give you the beginner's guide here for customizing your dashboard up to some more advanced topics, but if you really want to understand how things work, you'll want to take a look at some of the following resources as well:

- Grafana (graphing engine): [https://grafana.com/docs/grafana/latest/](https://grafana.com/docs/grafana/latest/)
- Prometheus (data scraping/monitoring): [https://prometheus.io/docs/](https://prometheus.io/docs/)

# 1.0 Dashboard Basics

In this section, we'll take a look at basic access to the FileWave dashboard and give information on it's various built-in components. If you intend to use this dashboard, but you are new to it, then this is the place to start.

# 1.1 Accessing the FileWave Dashboard

## What

Your account will need permission to access the FileWave Dashboard.

## When/Why

There are three permission levels for the dashboard for each admin logon:

- No Access
- Read-Only Access
- Read-Write Access

The permissions are defined with the following options in the Manage Administrators Assistant:

![](https://kb.filewave.com/uploads/images/gallery/2023-07/7BSE2ypG4tAIjucS-embedded-image-why4xp0i.png)

## How

Accessing the dashboard itself is quite simple once your account has proper permissions. From the WebAdmin, simply choose the Go To Dashboard link:

![](https://kb.filewave.com/uploads/images/gallery/2023-07/cweA85t6Gmsg3WFT-embedded-image-fiufblxf.png)

You will automatically be authenticated using the already established credentials to the WebAdmin. Note that all access to the dashboard is routed through the WebAdmin

# 1.2 Default Dashboard

## What

When you open the dashboard, FileWave shows the default system dashboard:

![8UY7FtkdSIjSj2OX-embedded-image-osexnofg.png](https://kb.filewave.com/uploads/images/gallery/2023-07/8UY7FtkdSIjSj2OX-embedded-image-osexnofg.png)

## When/Why

The default dashboard, *FileWave System*, gives you a quick health view of core FileWave services and configuration items. Green widgets indicate healthy or configured items, while red widgets point to items that need attention.

## How

Resolve the underlying issue to clear the dashboard warning. In the example above, the *dep* widget is red because no macOS client is specified for use by DEP. After you upload the pre-configured client, the widget should turn green.

# 1.3 FileWave Provided Dashboards

## What

FileWave includes several default dashboards. Some are useful for day-to-day admin checks, while others give FileWave Support a faster view into system health.

## When/Why

Use these dashboards as reporting examples and starting points. They show common ways to organize FileWave system, configuration, patching, application, and deployment status data.

![](https://kb.filewave.com/uploads/images/gallery/2023-07/OTpA30V3wA1Tpe7g-embedded-image-7h6xs7cv.png)

Operations dashboards focus on FileWave system performance. FileWave dashboards show configuration and system details. Patching dashboards are examples you can use when building your own reporting around patch, application, and deployment status.

## How

FileWave-provided dashboards are templates. You cannot edit them directly, but you can copy them and then adjust the panels, filters, transformations, and layout for your own reporting needs.

# 1.4 Switching Between Dashboards

## What

Use dashboards to move between FileWave data views after you log in.

## When/Why

Different dashboards show different slices of FileWave data. You can open dashboards in separate browser tabs, switch views in one tab, or use a playlist to cycle through dashboards automatically.

## How

For basic switching, use the dashboard links in the header as shown below:

<video controls="" height="300" width="600"><source src="https://kb.filewave.com/attachments/55"></source></video>

You can also use *Dashboards &gt; Manage* to browse dashboard folders, playlists, snapshots, and dashboard management actions:

![rP5NIxMTqjDWrdfE-embedded-image-syfbm2ip.png](https://kb.filewave.com/uploads/images/gallery/2023-07/rP5NIxMTqjDWrdfE-embedded-image-syfbm2ip.png)

# 1.5 Dashboard Panel/Widget Layout

## What

Dashboard panels/widgets can be moved and resized so the dashboard shows the most useful information first.

## When/Why

After you copy or add dashboard content, adjust the layout so related panels sit together and high-priority panels are easy to see.

## How

Drag a panel/widget to move it. Use the panel edge or corner handles to resize it, as shown in the video below:

<video controls="" height="300" width="600"><source src="https://kb.filewave.com/attachments/56"></source></video>

# 1.6 Exposing an Association to Dashboard

## What

FileWave can expose an association to the Dashboard so deployment progress is visible as a Dashboard widget.

## When/Why

Use this when a rollout is important enough that administrators or other stakeholders need a quick progress view. It is most useful for larger deployments, client upgrades, or staged rollouts where completion, remaining devices, warnings, and errors need to be watched without opening the association every time.

## How

1. Open the association you want to track.
2. On the association options, enable **Expose to Dashboard**.
3. Save the association and confirm the change through your normal FileWave workflow.
4. Open the Dashboard and review the association progress widget.

The exact surrounding labels may vary by FileWave version, but the association option is shown below.

![Association options showing the Expose to Dashboard checkbox](https://kb.filewave.com/uploads/images/gallery/2023-07/GH96b9Gyshy00PW8-embedded-image-ylmmijqp.png)

After the change is active and clients report status, the Dashboard shows progress for the exposed association.

![Dashboard association progress widgets showing completed, remaining, error, superseded, and warning status](https://kb.filewave.com/uploads/images/gallery/2023-07/SGw2tkX4NgxOxX6n-embedded-image-ljizkfsf.png)

## Related content

- [Configuring and using the Dashboard](https://kb.filewave.com/books/filewave-central-anywhere/page/configuring-and-using-the-dashboard)
- [Using Associations with Filesets](https://kb.filewave.com/books/filesets-payloads/page/create-and-manage-fileset-associations)

# Importing a Grafana Dashboard

## What

If another FileWave environment already has a useful Grafana dashboard, you can import its dashboard JSON instead of building the dashboard again from scratch.

## When/Why

Import a dashboard when you have a trusted dashboard export from another system and want to reuse the same layout, panels, and queries.

## How

From FileWave Anywhere, open Dashboard:

[![image.png](https://kb.filewave.com/uploads/images/gallery/2024-03/scaled-1680-/7U0eGrzSpi0Jmlgs-image.png)](https://kb.filewave.com/uploads/images/gallery/2024-03/7U0eGrzSpi0Jmlgs-image.png)

In Grafana, open **Home &gt; Dashboards**:

[![image.png](https://kb.filewave.com/uploads/images/gallery/2024-03/scaled-1680-/2yHBAIRsApXzlzck-image.png)](https://kb.filewave.com/uploads/images/gallery/2024-03/2yHBAIRsApXzlzck-image.png)

Select **New**, then **Import**:

[![image.png](https://kb.filewave.com/uploads/images/gallery/2024-03/scaled-1680-/MGjcXor6bqGhspLl-image.png)](https://kb.filewave.com/uploads/images/gallery/2024-03/MGjcXor6bqGhspLl-image.png)

Import the JSON file or paste the exported JSON content:

[![image.png](https://kb.filewave.com/uploads/images/gallery/2024-03/scaled-1680-/veBpmH22gsCHfJjw-image.png)](https://kb.filewave.com/uploads/images/gallery/2024-03/veBpmH22gsCHfJjw-image.png)

Set a dashboard name and destination. Each Grafana dashboard must have a unique UID:

[![image.png](https://kb.filewave.com/uploads/images/gallery/2024-03/scaled-1680-/31WNY4JIq8Asa1oa-image.png)](https://kb.filewave.com/uploads/images/gallery/2024-03/31WNY4JIq8Asa1oa-image.png)

The dashboard is now imported:

[![image.png](https://kb.filewave.com/uploads/images/gallery/2024-03/scaled-1680-/8sZ58LO46QvaAbcE-image.png)](https://kb.filewave.com/uploads/images/gallery/2024-03/8sZ58LO46QvaAbcE-image.png)

## Related Content

- [Content Packs](https://kb.filewave.com/books/content-packs "Content Packs")
- [Dashboard (Grafana)](https://kb.filewave.com/books/dashboard-grafana "Dashboard (Grafana)")

# 2.0 Custom Dashboards for Beginners

Once you get the hang of the elements that are provided for you automatically, you may want to take the next step and start creating custom dashboards of your own.  
  
FileWave supplied dashboards will only take you just so far. As soon as you want to know specific information about your environment and your deployments you are going to want to create your own dashboards with your own dashboard elements.  
  
The contents for customization are broken into two parts. In the first (this section) we'll look at the components of dashboards and show you how you can build your own simple custom dashboards. In the next section, we'll get much more detailed and advanced.

# Using Grafana for Data Aggregation

## What

Grafana dashboards in FileWave can aggregate report data, such as grouping devices by FileWave Client version or counting devices missing each patch. This article shows how to build an aggregated visualization from a FileWave report.

## When/Why

Use data aggregation when a dashboard should show counts or grouped totals instead of a raw list of devices. For example, you might create a report of devices missing OS patches, group the results by patch name, and count the devices missing each patch for a bar or pie chart.

## How

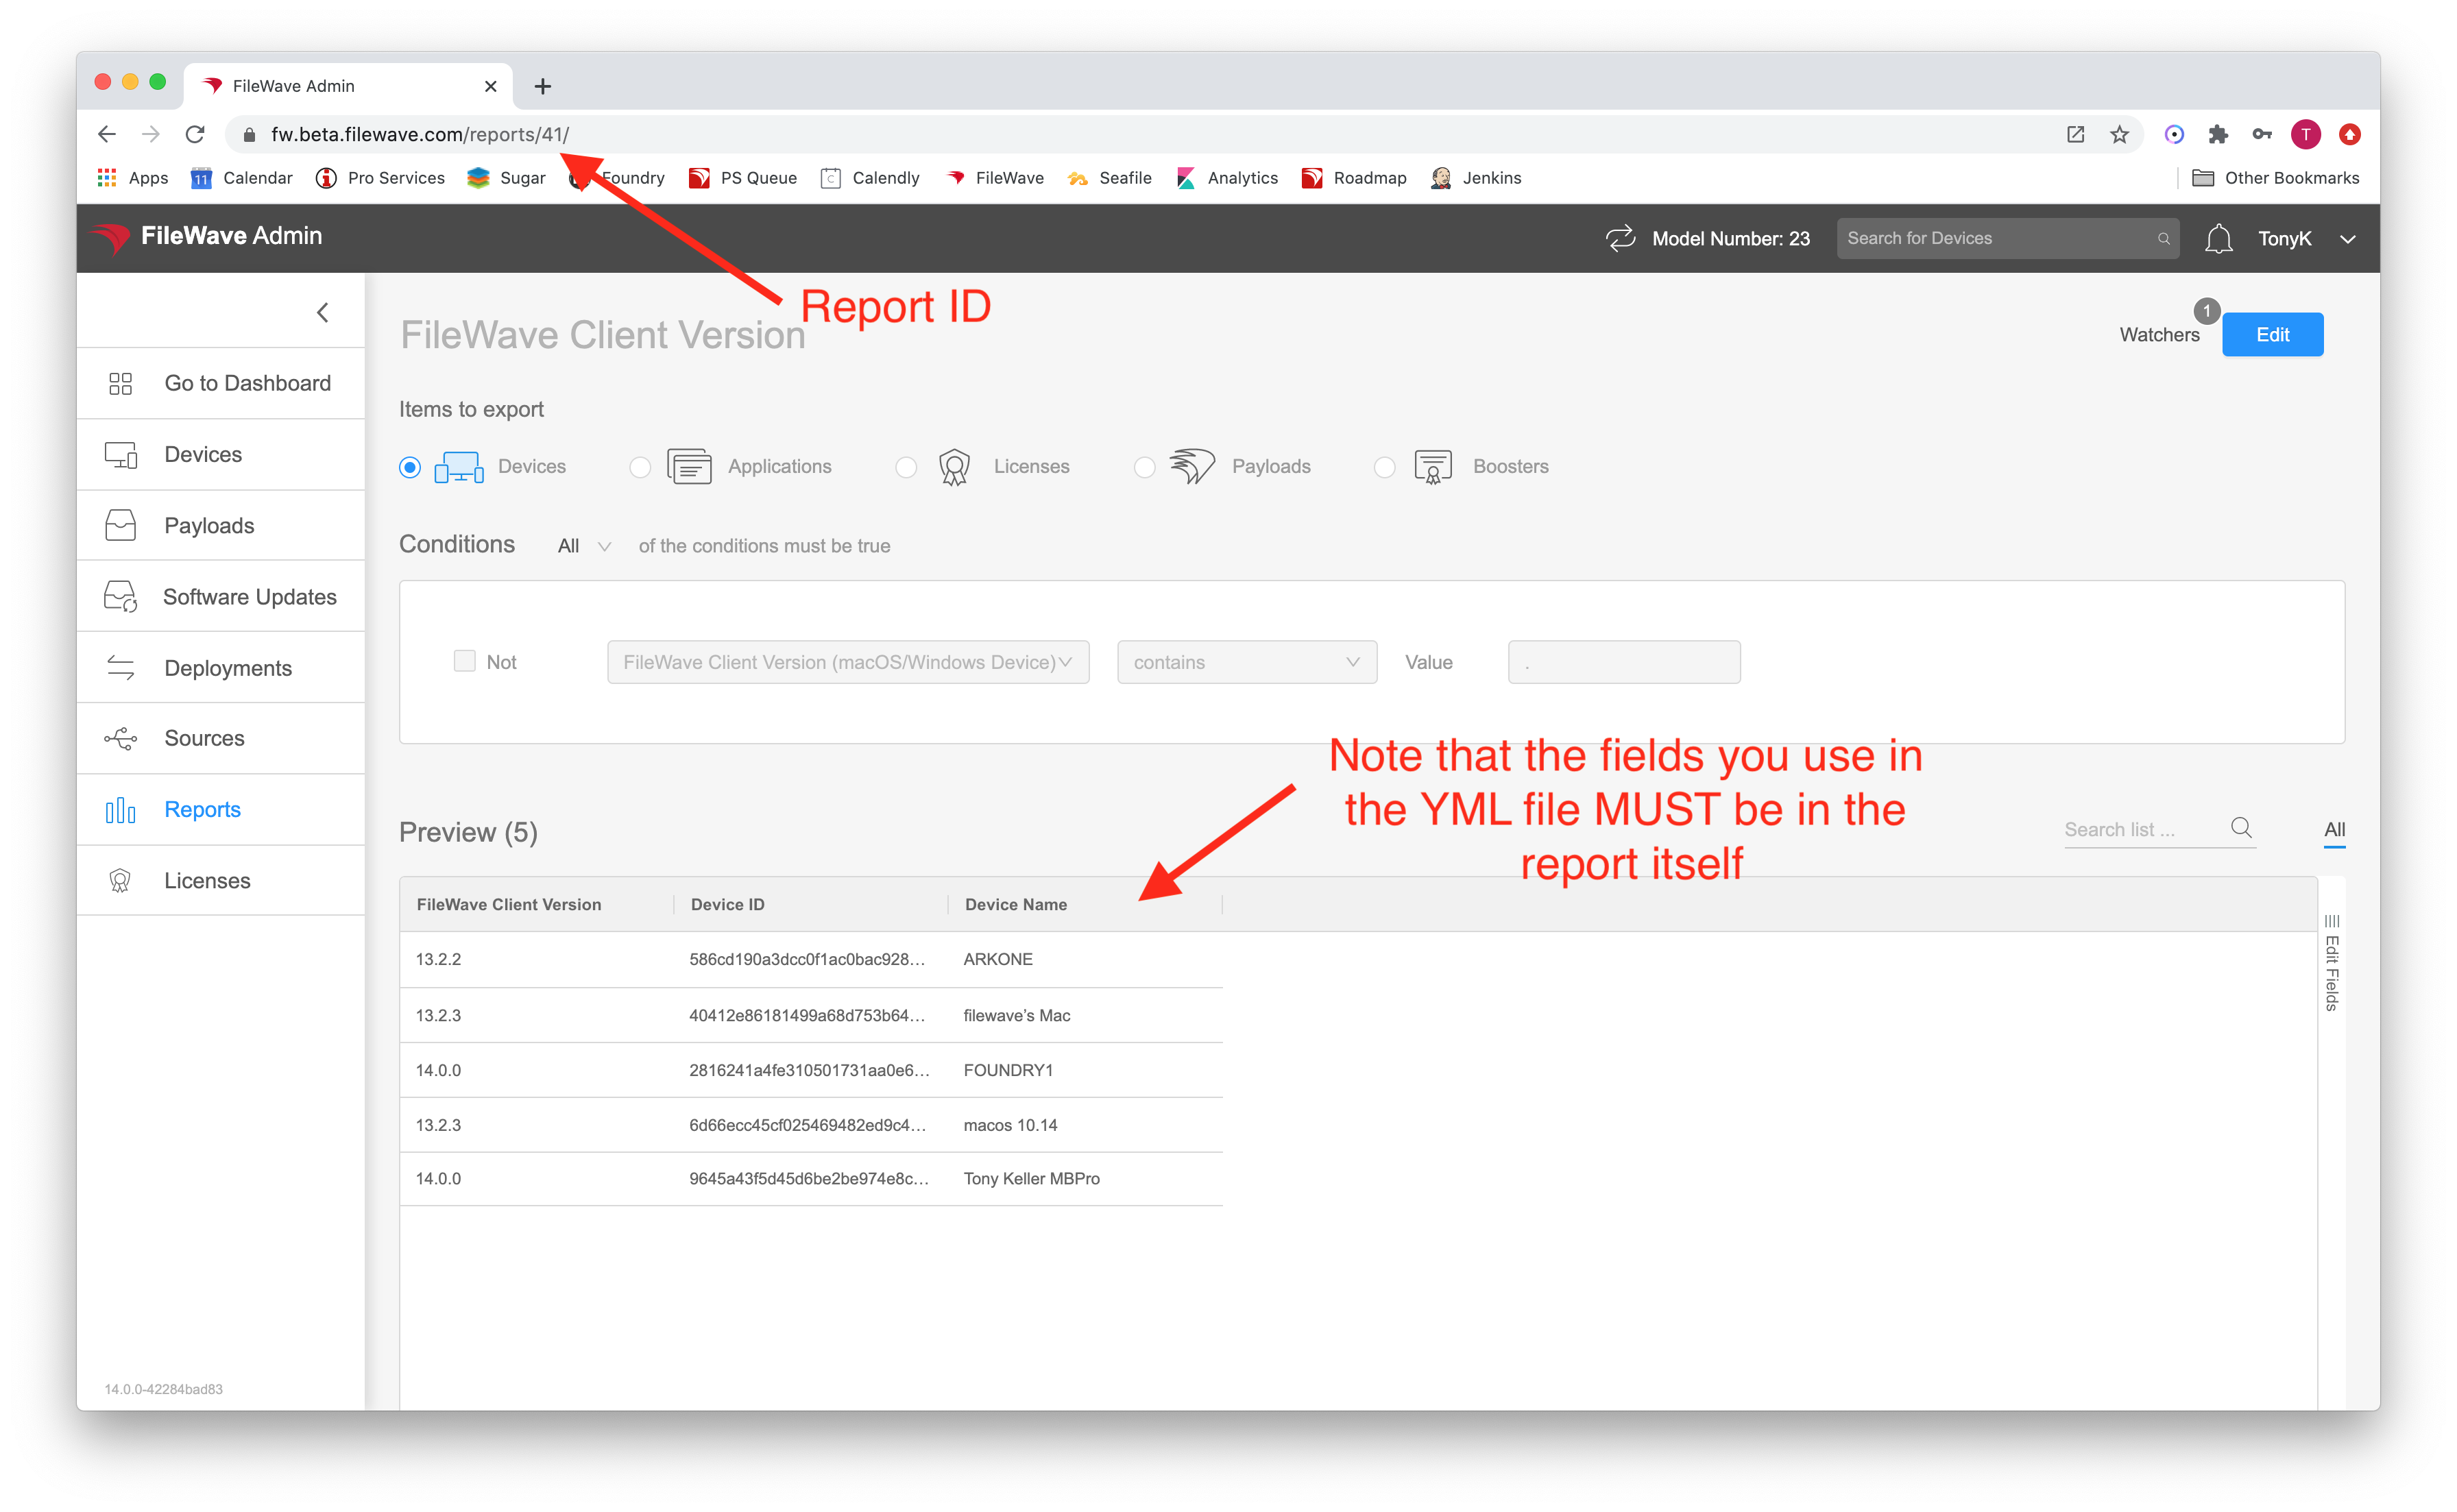
Start with a FileWave report that returns only the fields you want to chart. In this example, the report shows the FileWave Client version for macOS and Windows devices:

[![image.png](https://kb.filewave.com/uploads/images/gallery/2024-03/scaled-1680-/NijqHxZO6vGx9DKC-image.png)](https://kb.filewave.com/uploads/images/gallery/2024-03/NijqHxZO6vGx9DKC-image.png)

The report filters out blank client-version values so the dashboard does not count empty placeholders. It includes two fields: FileWave Client Version, which will be grouped, and Device ID, which will be counted. This small test system produces a short result set:

[![image.png](https://kb.filewave.com/uploads/images/gallery/2024-03/scaled-1680-/QkQuVExR2U9XLqH8-image.png)](https://kb.filewave.com/uploads/images/gallery/2024-03/QkQuVExR2U9XLqH8-image.png)

Open Dashboard from FileWave Anywhere, then follow the video to create the aggregated visualization:

<video class="align-center" controls="" height="386" src="https://kb.filewave.com/attachments/318?open=true" style="width:687px;height:386px;" width="687"></video>

## Related content

- [Dashboard (Grafana)](https://kb.filewave.com/books/dashboard-grafana "Dashboard (Grafana)")
- [Content Packs](https://kb.filewave.com/books/content-packs "Content Packs")

# 2.1 Creating Your Own Dashboard

## What

FileWave dashboards can be customized. You can start with the included dashboards, then build your own views for the data your team checks most often.

## When/Why

Dashboard elements, also called widgets, can be combined into custom dashboards. You can copy widgets from existing FileWave dashboards or create new widgets directly.

## How

This example creates a new empty dashboard. It starts with a folder because most environments eventually have more than one custom dashboard. After creating the dashboard, use the related copying-widgets article to add content to it.

<video controls="controls" height="300" width="600"><source src="https://kb.filewave.com/attachments/57"></source></video>

# 2.2 Copying Widgets (Panels)

## What

Copy an existing Grafana panel, called a widget in this KB series, when another dashboard already has the view you need.

## When/Why

This is useful when a panel already has the right query, visualization, or layout and you want to reuse it in a custom dashboard instead of rebuilding it. The video below copies panels from existing dashboards into a new custom dashboard.

## How

Copying existing dashboard content is a normal Grafana workflow: copy the panel, paste it into the target dashboard, adjust it if needed, and repeat for the next panel.

<video controls="" height="300" width="600"><source src="https://kb.filewave.com/attachments/58"></source></video>

<table id="bkmrk-if-you-find-that-you"><tbody><tr><td>If you find that your copied panel is blank, take a look at resolving that in this article: [Fixing Blank Copied Panel](https://kb.filewave.com/books/dashboard-grafana/page/221-copied-panel-is-blank "2.2.1 Copied Panel is Blank")

</td></tr></tbody></table>

# 2.2.1 Copied Panel is Blank

## What

If a copied dashboard panel is blank, recreate the variables that the panel expects in the destination dashboard, then save the dashboard and reload the panel.

## When/Why

This most often happens when the source dashboard has variables that the panel depends on, but the destination dashboard does not. For example, if a panel relies on `$host` for the server address and the destination dashboard does not define `$host`, the panel can paste successfully but render blank.

## How

Below you'll see the issue:

<video controls="" height="300" width="600"><source src="https://kb.filewave.com/attachments/59"></source></video>

Fixing the issue requires recreating the variables in the destination dashboard. Grafana does not copy those variables with the panel, so recreate them manually. In any dashboard, open **Dashboard Settings → Variables** to review the variables:

![ydmFVFgDah0wPdjJ-embedded-image-lyq5d0tm.png](https://kb.filewave.com/uploads/images/gallery/2023-07/ydmFVFgDah0wPdjJ-embedded-image-lyq5d0tm.png) then ![nV7c16QJqaII1fTj-embedded-image-d1wjtszv.png](https://kb.filewave.com/uploads/images/gallery/2023-07/nV7c16QJqaII1fTj-embedded-image-d1wjtszv.png)

Recreate the same variable names and values in your destination dashboard:

![xq4ECGcgB011M9oD-embedded-image-ffjlyvlt.png](https://kb.filewave.com/uploads/images/gallery/2023-07/xq4ECGcgB011M9oD-embedded-image-ffjlyvlt.png)

After saving the variables, reload the dashboard. The copied panel should now render with data:

![syhZ3XwlYf2iaU33-embedded-image-jjr4maez.png](https://kb.filewave.com/uploads/images/gallery/2023-07/syhZ3XwlYf2iaU33-embedded-image-jjr4maez.png)

# 2.3 Dashboard Widget and Panel Elements

## What

Every FileWave dashboard panel, also called a widget, is built from the same basic elements. This article explains what each element controls before you create a custom panel.

## When/Why

You can use an existing panel without changing these elements. When you build or troubleshoot a custom panel, they determine its data, display, and general behavior.

## How

A dashboard panel has three main elements:

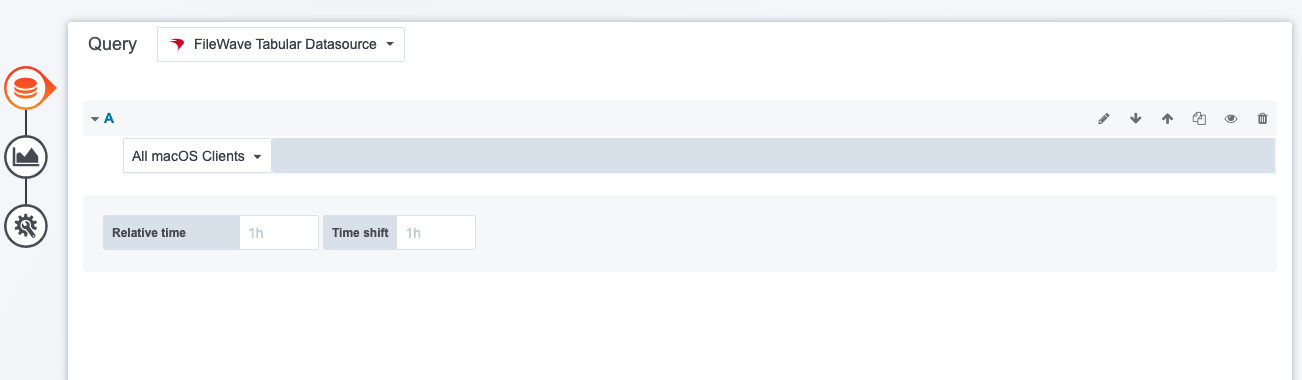
- The Query (Choosing what data you want to see in the panel)
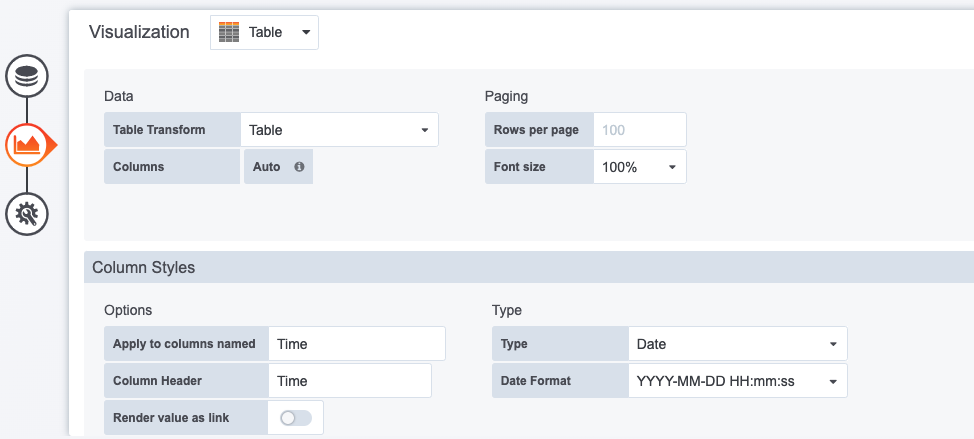
- The Visualization (Choosing the visual representation of the data: gauge, bar chart, table...)
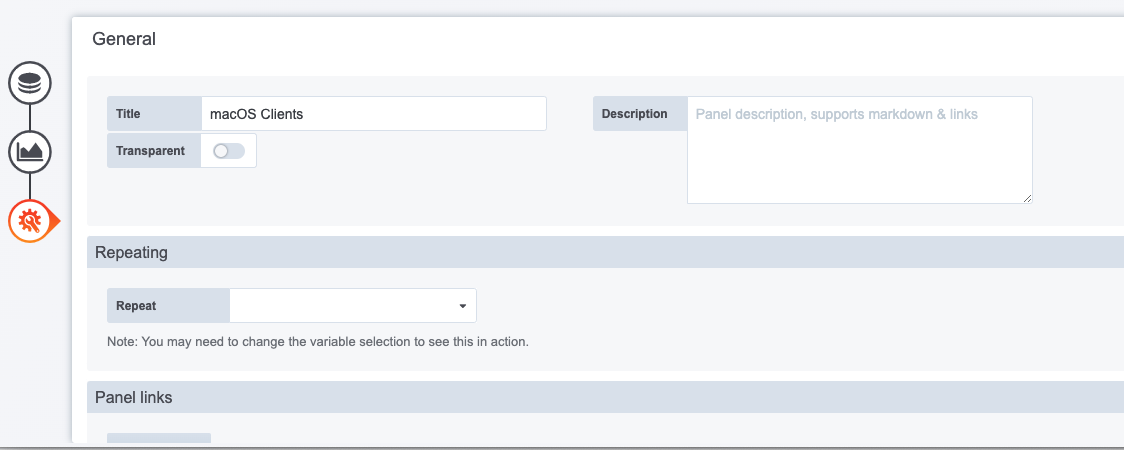
- General (Panel properties such as title, comment, links)

The examples below show each element in the panel editor:

<table id="bkmrk-the-query-the-visual"><tbody><tr><td>The Query

</td></tr><tr><td>![VTUwLKmE0O6wsypu-embedded-image-wl36jnfs.png](https://kb.filewave.com/uploads/images/gallery/2023-07/VTUwLKmE0O6wsypu-embedded-image-wl36jnfs.png)

</td></tr><tr><td>The query defines the data available to the panel. This example uses an inventory query.

</td></tr></tbody></table>

<table id="bkmrk-the-visualization-be" style="width:100%;height:341.664px;"><tbody><tr style="height:35.3984px;"><td style="width:100%;height:35.3984px;">The Visualization

</td></tr><tr style="height:203.672px;"><td style="width:100%;height:203.672px;">![OsBbzUaz6X14ZrvI-embedded-image-c4o3g03g.png](https://kb.filewave.com/uploads/images/gallery/2023-07/OsBbzUaz6X14ZrvI-embedded-image-c4o3g03g.png)

</td></tr><tr style="height:102.594px;"><td style="width:100%;height:102.594px;">An inventory query returns table-shaped data, so this example uses a table visualization. Other data sources can support gauges, charts, and graphs.

</td></tr></tbody></table>

<table id="bkmrk-general-we-only-spec"><tbody><tr><td>General

</td></tr><tr><td>![p8PIE52FsNxw9Bsa-embedded-image-nmjxglpu.png](https://kb.filewave.com/uploads/images/gallery/2023-07/p8PIE52FsNxw9Bsa-embedded-image-nmjxglpu.png)

</td></tr><tr><td>This example sets only the panel name. You can also add a link that opens the related FileWave report, giving dashboard users a direct path to the underlying device data.

</td></tr></tbody></table>

# 2.4 Creating a New Panel (existing data)

## What

Dashboard panels can use existing FileWave Inventory Reports (formerly Queries) as their data source. The panel uses the report rows directly, so this method is best for table panels and does not aggregate values.

## When/Why

Use this when a report already shows the device or inventory data you want to share on a dashboard, such as a list of macOS clients. The dashboard panel gives that report a shared Grafana view without rebuilding the report logic.

## How

When creating the panel, choose **FileWave Tabular Datasource** for the panel query. FileWave makes Inventory Reports available automatically through that datasource. The walkthrough below shows a table-based panel built from a report that lists macOS clients.

<video controls="" height="300" width="600"><source src="https://kb.filewave.com/attachments/60"></source></video>

# 3.0 Advanced Dashboard Primer

Aren't you an intrepid explorer! Look at you jumping right to the advanced section! Well, we are glad you are here. In this section we'll be looking at how you can create much more complex dashboard content.  
  
As soon as you want to go beyond supplied panels, or direct data from inventory queries, then things are going to get a bit more complex. However, don't be daunted! We are going to give you the building blocks here for building complex and very meaningful aggregate data from FileWave sources.  
  
Please see the articles below for the elements we'll build on:

# 3.1 Aggregating Data

## What

The FileWave dashboard can show raw device data, but aggregated data is what gives you the quick summary. Aggregation rolls many records into something easier to read, such as counts by version, model, or status.

## When/Why

Use aggregation when you need the big picture instead of a long list. For example, if you are rolling Java from build 183 to build 196, a per-device report shows every record, but an aggregated view shows how many devices are still on each version. That makes rollout progress much easier to understand at a glance.

## How

To get aggregated data into Grafana, create a Prometheus scrape job that summarizes the inventory-query data you care about. The next articles in this section walk through that process: define the Prometheus job, test the scrape, review the resulting metric in Explore, and then turn it into a panel.

# 3.1.1 Grouping Data Using Prometheus

## What

In order to do summary reporting, we need to leverage the power of Prometheus.

## When/Why

Anytime we want to do something like report on a rollout or general status, we are going to want to summarize a report. We will accomplish this by using a Prometheus config file on the FileWave server itself.

## How

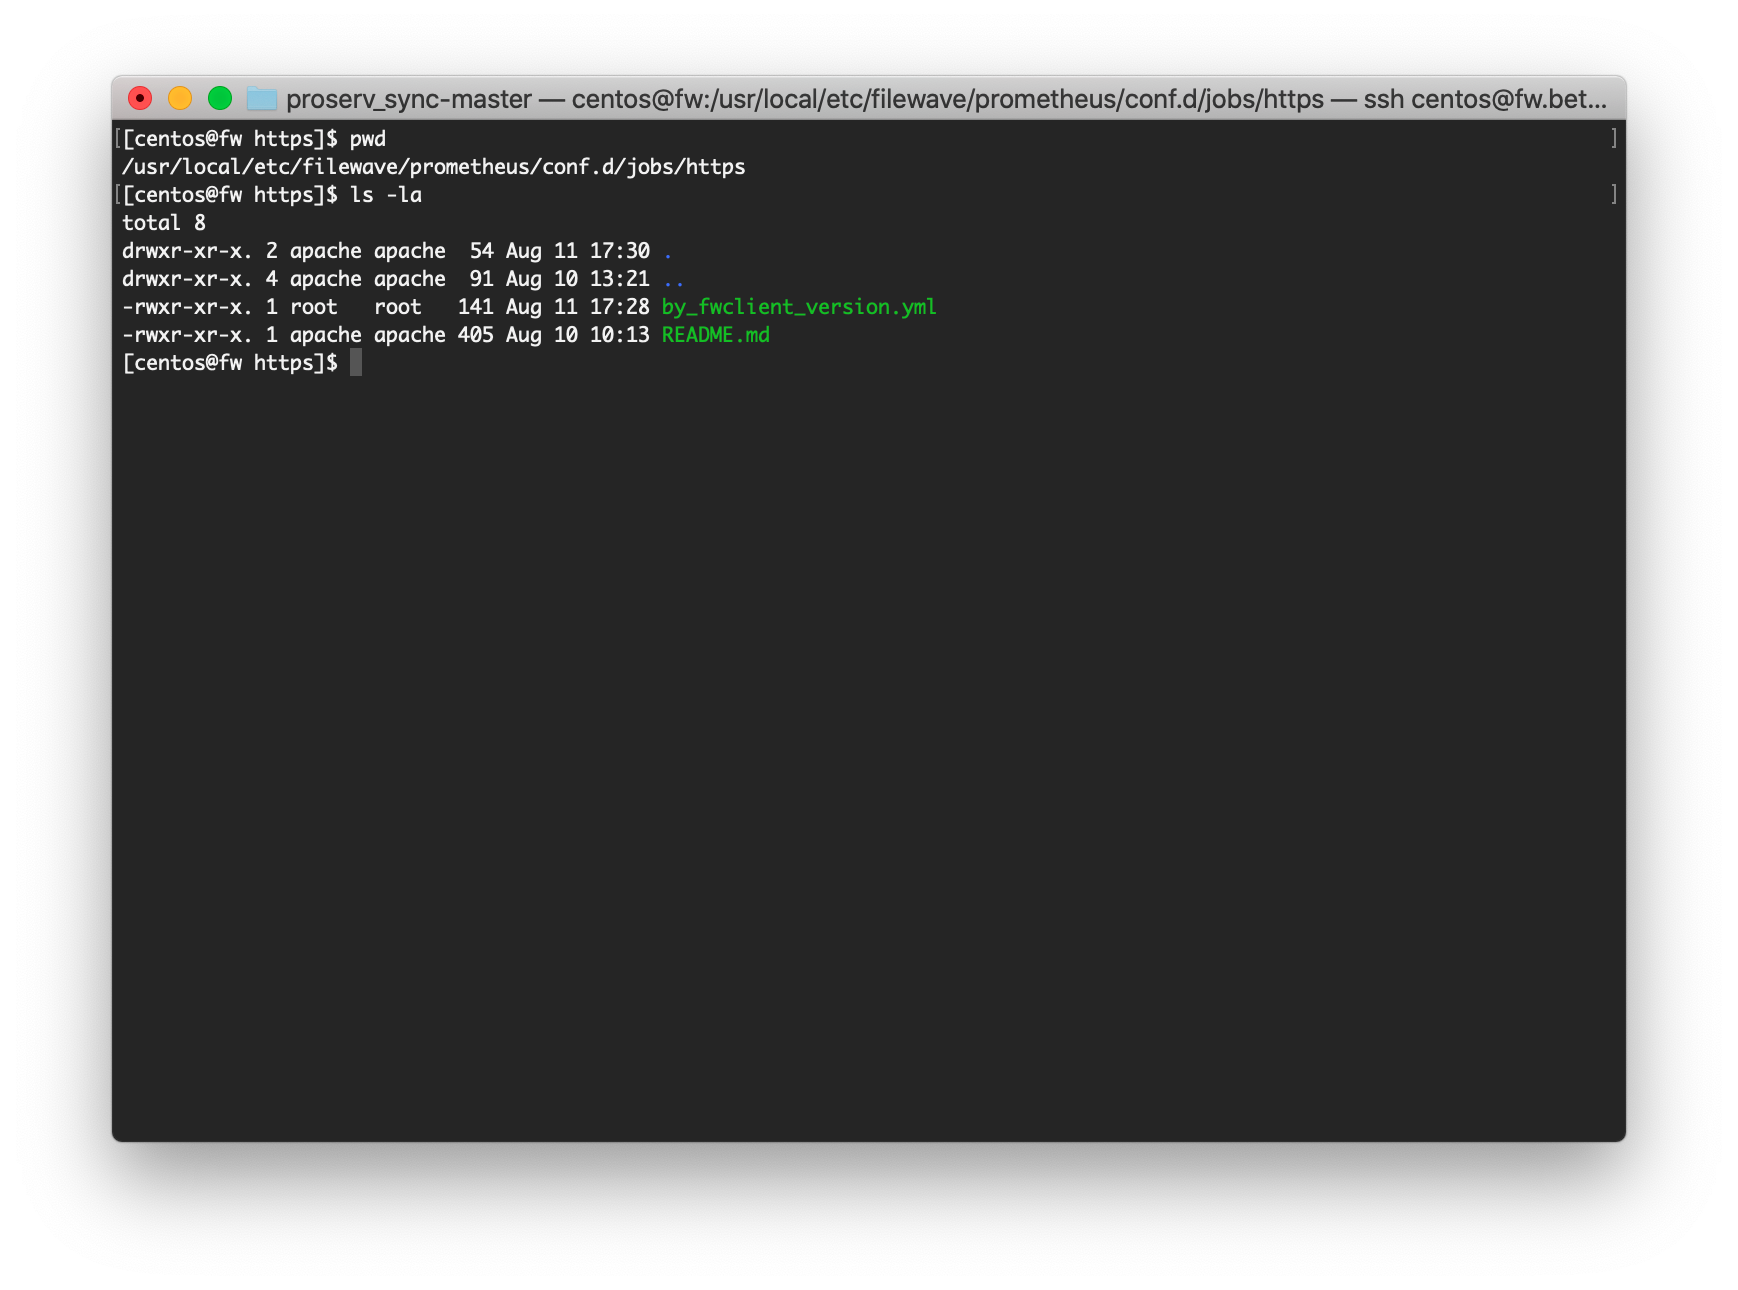
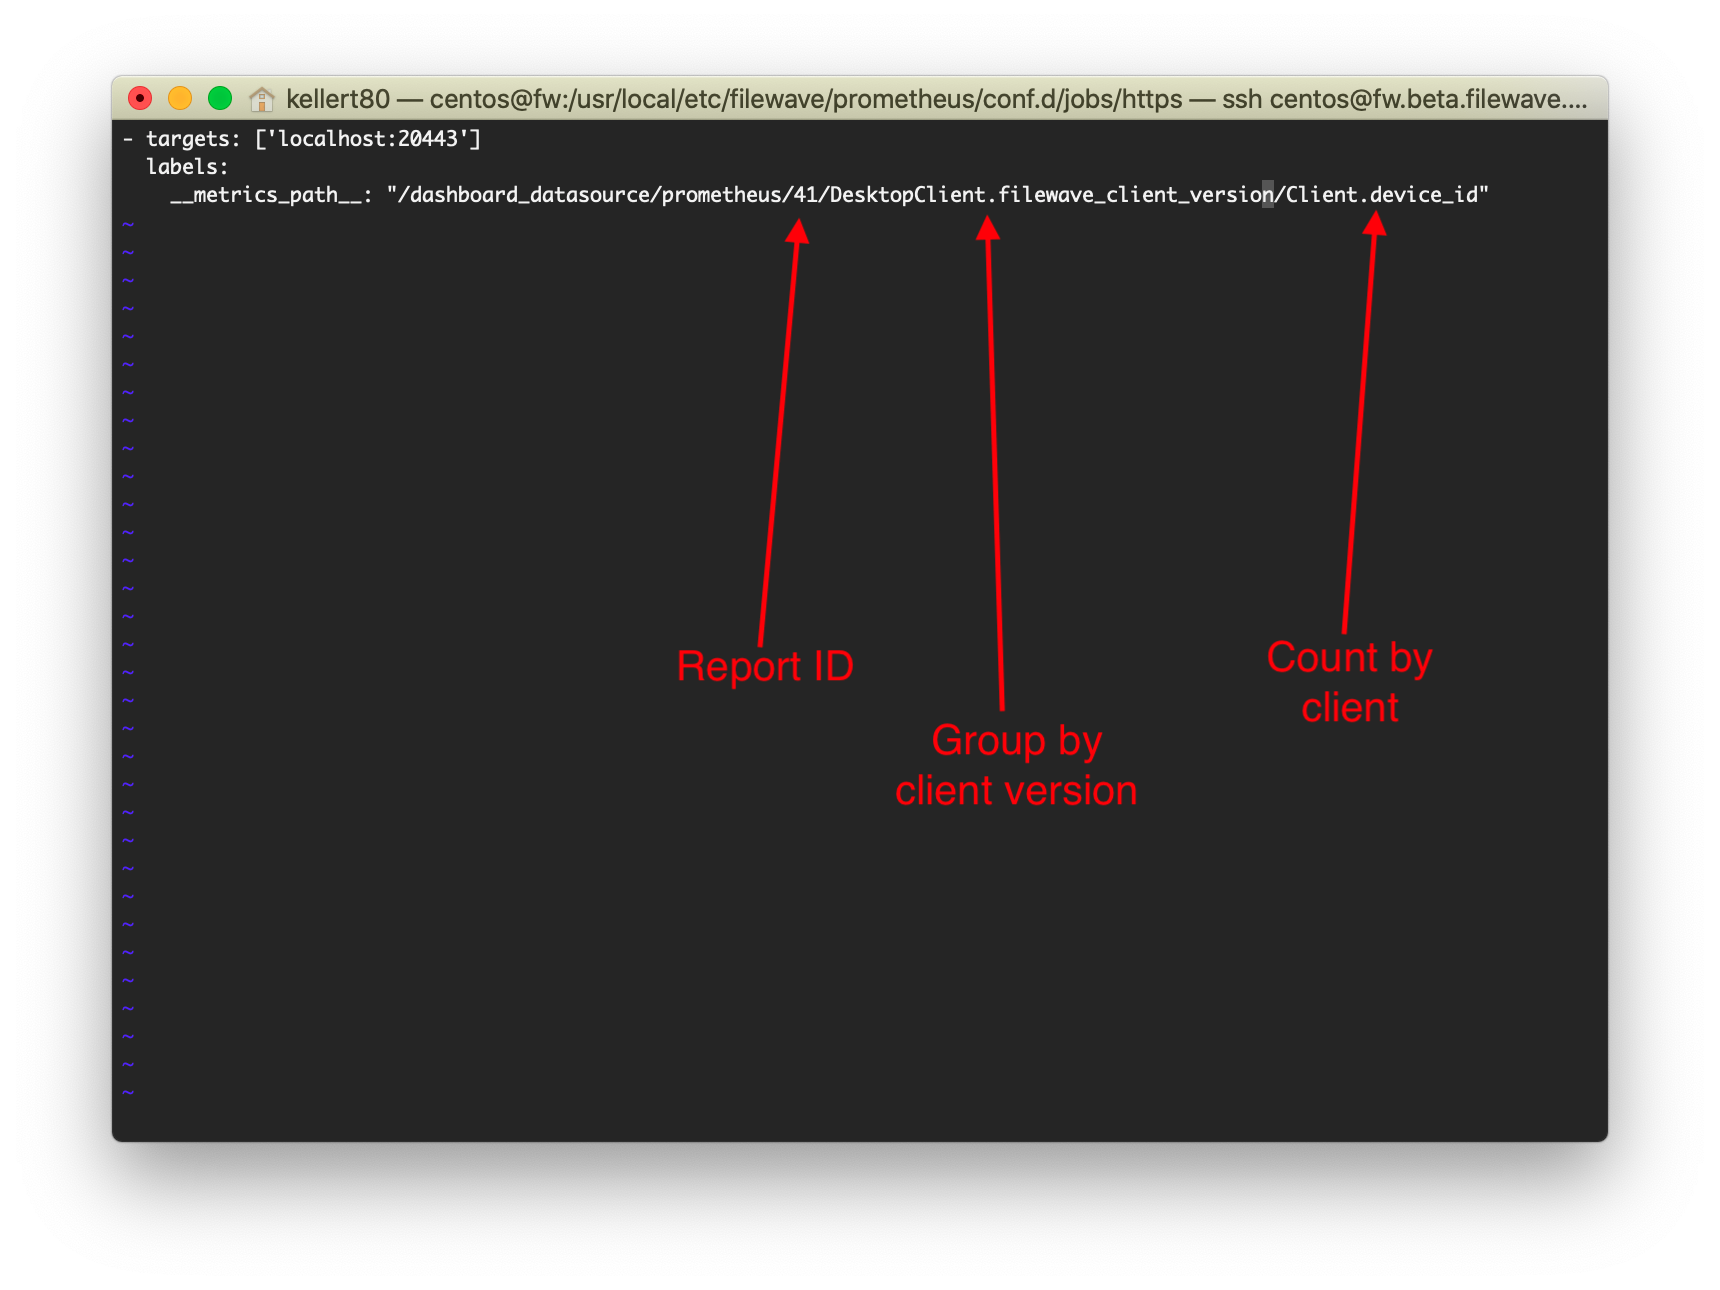
The configuration (or yml files) that we'll create will always be placed in the **/usr/local/etc/filewave/prometheus/conf.d/jobs/https** directory on the FileWave server. Anything placed in this directory will automatically be read by Prometheus, and the data presented to our dashboard. (Example yml files can be found in /usr/local/etc/filewave/prometheus/conf.d/jobs)

The syntax of these files is quite picky, so it is best to copy an existing one, and then modify it. It may seem complicated, but we are always going to do the following steps:

<table id="bkmrk-%C2%A0-%C2%A0-step-example-1.-"><thead><tr><th> </th><th> </th></tr></thead><tbody><tr><td>Step</td><td>Example</td></tr><tr><td>1. Place a new (or copied) yml file into /usr/local/etc/filewave/prometheus/conf.d/jobs/https with a meaningful name.</td><td>![image2020-8-11_13-31-54.png](https://kb.filewave.com/uploads/images/gallery/2023-07/e4kS94SKs3qxXpmV-image2020-8-11-13-31-54.png)</td></tr><tr><td>2. Edit the new file to specify the following 3 things:  
  
\* The inventory query (report) to use  
\* The field you want to count by...device\_id is almost always a good one if reporting by device  
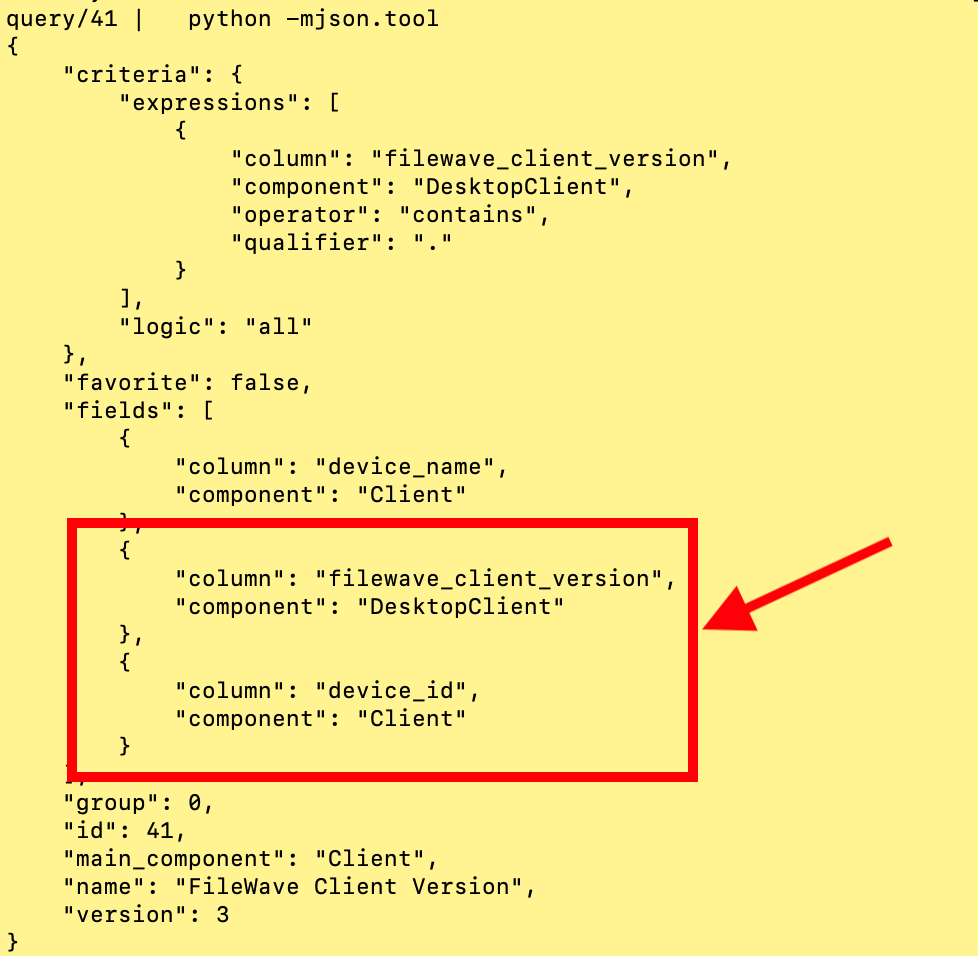
\* The field you want summarize (aggregate) by...in this case, the filewave client version</td><td> </td></tr><tr><td>3. Once your report is created, the report id to use is most easily accessed through the webadmin. Note that the fields you want to use for aggregation must be in the report.</td><td>![Report YML Config.png](https://kb.filewave.com/uploads/images/gallery/2023-07/F35g36Iot5EL6xEh-report-yml-config.png)</td></tr><tr><td>4. Get the definition for the fields you want to use from the API...the easiest way is to do a curl from the command line like this:   
  
`bash<br>curl -s -k -H "Authorization: <Base64_API_Token>" https://<my.server.address>:20445/inv/api/v1/query/<report_id> | python -mjson.tool<br>`  
  
Make sure and substitute in your values for the &lt;Base64\_API\_Token&gt;, &lt;my.server.address&gt; and &lt;report\_id&gt;  
  
You'll get a response that includes the component and the field names as shown at right</td><td>![image2020-8-11_14-43-10.png](https://kb.filewave.com/uploads/images/gallery/2023-07/cigapWuESXaaVaFj-image2020-8-11-14-43-10.png)</td></tr><tr><td>4. Edit the YML file to specify the 3 items as they match your report definition, then save the file. If using the sample file, remember to take out the comment # at the beginning of each line. Example at right:</td><td>![image2020-8-11_14-50-19.png](https://kb.filewave.com/uploads/images/gallery/2023-07/yJhig0WZ1YeFgvDx-image2020-8-11-14-50-19.png)</td></tr></tbody></table>

Within a minute or two of creation of the file, the data should be available in your dashboard for a new panel.

# 3.1.2 Testing the Prometheus Scrape

## What

If a scrape target does not appear in Grafana, first check whether Prometheus can see the job and whether the scrape is failing.

## When/Why

Prometheus exposes a targets page that shows the status of configured scrapes. That page is the quickest place to check for YAML mistakes, missing jobs, and scrape errors.

## How

The Prometheus targets page is not open to external systems by default. If the port were open, you would browse to [https://my.server.address:21090/targets](https://my.server.address:21090/targets). Because it is closed, create an SSH tunnel from your computer instead. From Terminal on macOS, run:

<table id="bkmrk-ssh--l-8000%3Alocalhos"><tbody><tr><td>ssh -L 8000:localhost:21090 user@my.server.address

</td></tr></tbody></table>

On Windows, you can do the same thing in PuTTY by configuring a tunnel from a local port of your choice to the FileWave Server:

![](https://kb.filewave.com/uploads/images/gallery/2023-07/K4MSsRmyL9adviPm-embedded-image-iyskfedd.png)

These configurations send local traffic on port 8000 through the SSH connection to port 21090 on the FileWave Server. After the tunnel is connected, open [http://localhost:8000/targets](http://localhost:8000/targets) in your browser to view the scrape data.

The example below shows a job with a bad query reference. Query 153 does not exist, so Prometheus reports the scrape error on the targets page:

![](https://kb.filewave.com/uploads/images/gallery/2023-07/pidPLTTtnN4iQpYz-embedded-image-q0djazlc.png)

# 3.1.3 "Exploring" Your New Aggregate Data

## What

Before you build a formal Grafana panel, it often helps to look at the aggregated data directly. The Explore view is the fastest way to sanity-check what your report is producing.

## When/Why

Use Explore after you have configured the Prometheus scrape and want to confirm the metric looks right before turning it into a panel.

## How

Aggregated inventory-query data is exposed in Dashboard metrics as `filewave_inventory_query_<id>`, where `<id>` is the report ID you used. The attached video shows the Explore workflow for one of those metrics.

<video controls="" height="300" poster="" width="600"><source src="https://kb.filewave.com/attachments/61"></source></video>

In this example, the data is no longer shown as five separate records. Instead, it has been grouped into three records because only three different FileWave client versions are present across the endpoints. That grouped result is much easier to use when you build a chart, such as a pie chart, in the next step.

# 3.1.4 Creating your Data Panel

## What

Once your aggregated metric is available in Grafana, you can turn it into a panel that answers the question you actually care about.

## When/Why

Pick the visualization based on the story the data needs to tell. Pie charts work well for a current distribution, such as how many devices are on each client version right now. Line or bar charts are better when you want to watch that same data change over time.

## How

Creating the panel is similar to the earlier dashboard examples, but now you are working with aggregated Prometheus data instead of a simple raw query result. The video below shows the basic workflow.

<video controls="" height="300" width="600"><source src="https://kb.filewave.com/attachments/62"></source></video>

Grafana gives you a lot of freedom in how a panel is presented. One small detail that helps immediately is the legend format. In this example, using `{{genericdesktopclient__filewave_client_version}}` makes the legend display the actual version value instead of a less useful raw field name.

We chose **Instant** in this example because the goal is a current snapshot, which is usually the right choice for a pie chart. If you want to see the same metric trend over time, use a visualization such as a bar or line chart and query the time-series data instead.

# 3.2 Extra Metrics

## What

We learned in the 3.1 section how to build our own custom panels. "Extra Metrics" is an independently built tool to automate creation of a few reporting elements for us without doing it manually. This solution is NOT directly supported by FileWave, but you may find it useful in your environment.

## When/Why

"Extra Metrics" gives data on applications, and generally on patch status of your devices. The patch status elements are hard-coded, but the application versions panels are driven by dynamic reports that you can tweak to fit your needs. All information for installation and upgrade of this solution is found here: [https://pypi.org/project/filewave-extra-metrics/#description](https://pypi.org/project/filewave-extra-metrics/#description)

## How

In this example, we have Extra Metrics installed, and are adding a new report to view Firefox information on macOS devices.

<video controls="controls" height="300" width="600"><source src="https://kb.filewave.com/attachments/63"></source></video>

# 4.0 Dashboard Alerts

With the Custom Dashboards configured you can now choose to configure email alerts based upon conditions met. Alerts are only available for Visualisations of type Graph.  
  
Custom Dashboards provide live information, but for some you will want to receive notifications when certain criteria has been reached. Two elements require configuring, email and the alert itself: Email and Alert

# 4.1 Grafana Email Configuration

## What

Use this process to configure email in Grafana so alert notifications can be sent by email.

## When/Why

Configure email before you create or test alert notifications.

## How

Edit the Grafana configuration file on the FileWave Server:

<table id="bkmrk-%2Fusr%2Flocal%2Fetc%2Ffilew"><tbody><tr><td>/usr/local/etc/filewave/grafana/conf/filewave.ini

</td></tr></tbody></table>

Add or update the `[smtp]` section with your mail server details. Set `enabled = true` so Grafana can actually send mail. If your mail relay requires client certificate authentication, you can also set `cert_file` and `key_file`.

```shell
[smtp]
enabled = true
host = smtp.example.com:587
user = smtp-user
# If the password contains # or ; wrap it in triple quotes, for example """#password;"""
password = """smtp-password"""
cert_file =
key_file =
skip_verify = false
from_address = alerts@example.com
from_name = FileWave Grafana
ehlo_identity =

```

Leave the existing FileWave-specific settings in place, and only change the SMTP values you need. If your relay does not use client certificates, leave `cert_file` and `key_file` empty.

For the full list of available SMTP options, see [Grafana's configuration documentation](https://grafana.com/docs/grafana/latest/administration/configuration/#smtp).

After saving the file, restart the FileWave Server so Grafana reloads the configuration:

<table id="bkmrk-sudo-fwcontrol-serve"><tbody><tr><td>sudo fwcontrol server restart

</td></tr></tbody></table>

Then open Grafana, go to the Alerting section, choose **Contact points**, create or edit an Email contact point, and send a test notification.

# 4.2 Configure Grafana Dashboard Alerts

## What

Dashboard alerts notify you when a graph crosses a condition you define.

<p class="callout info">Alerts are available only for visualizations of type **Graph**.</p>

## When/Why

Use an existing custom dashboard graph as the data source for an alert.

## How

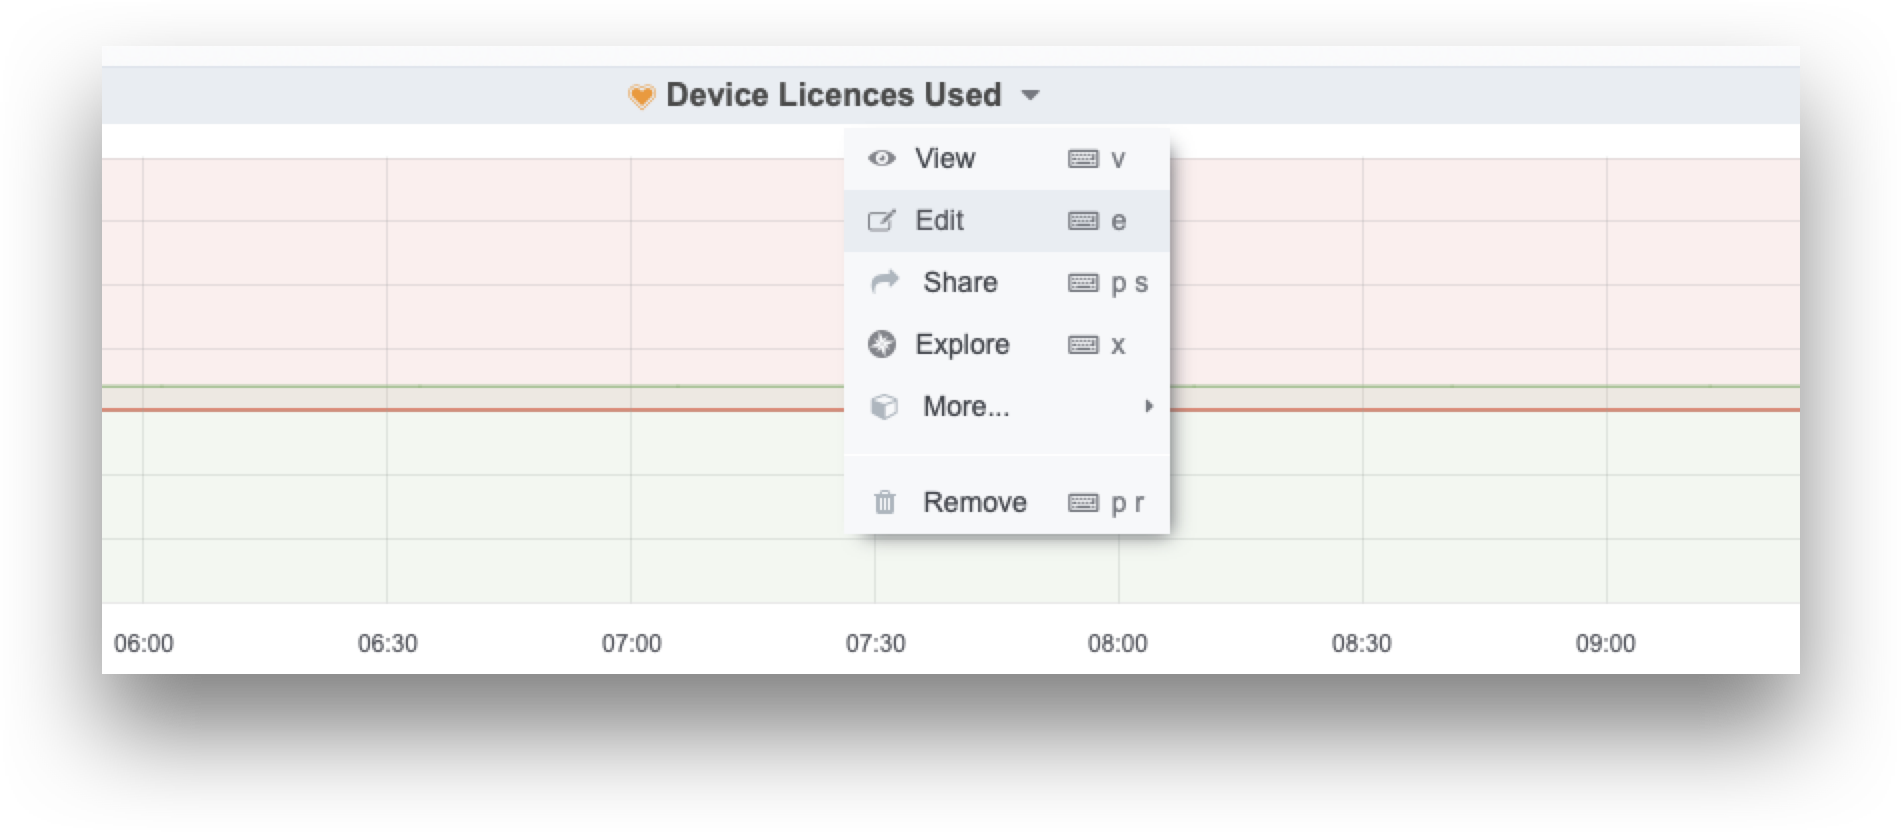
Open the graph's drop-down menu and select **Edit**:
![hNg2woEX45vBtlqW-embedded-image-yop5d4ej.png](https://kb.filewave.com/uploads/images/gallery/2023-07/hNg2woEX45vBtlqW-embedded-image-yop5d4ej.png)

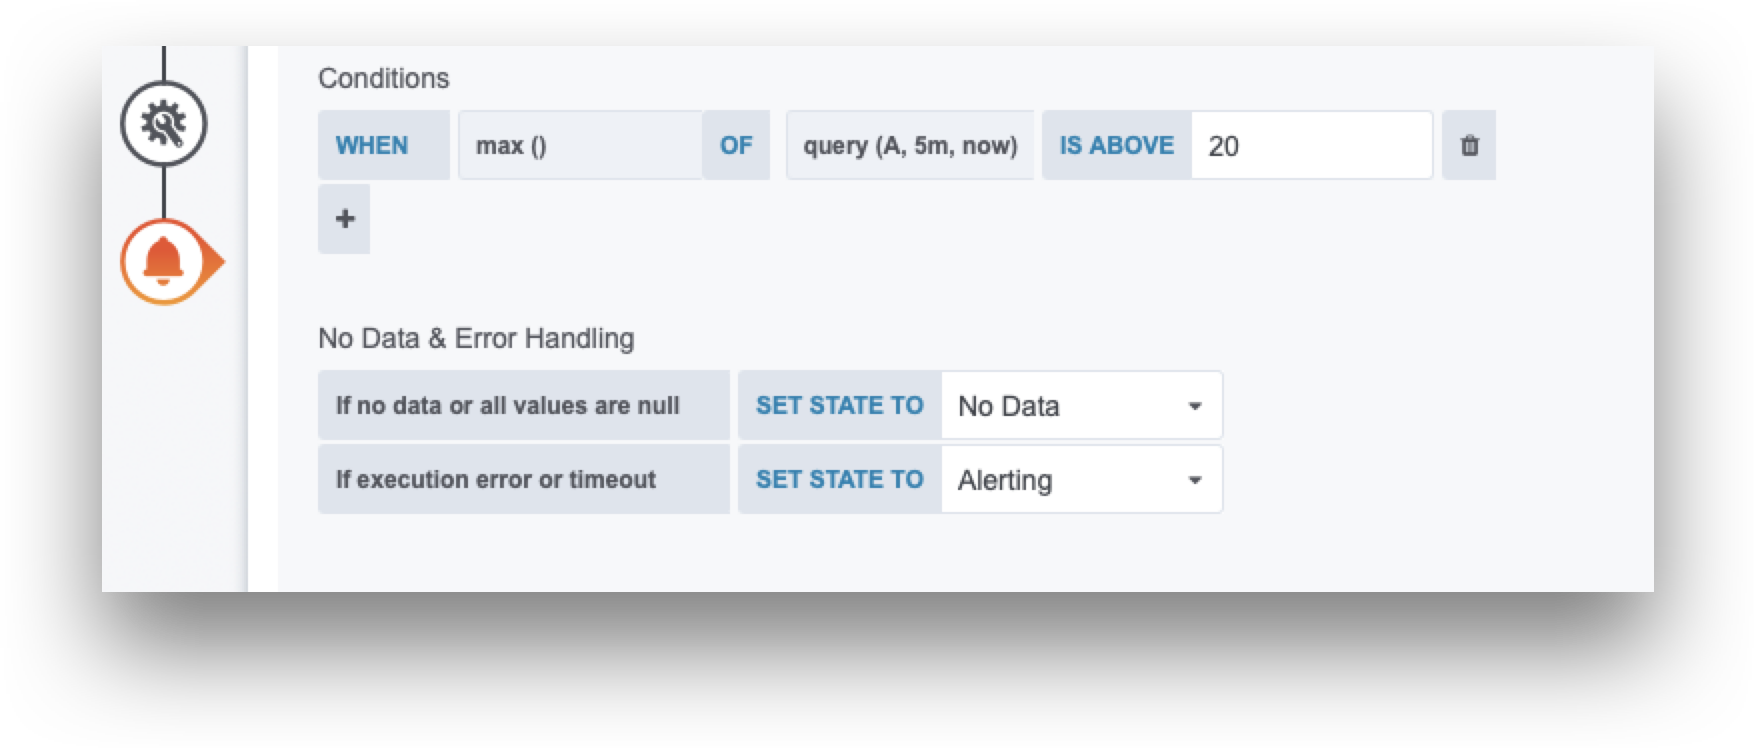
Select the Notification icon and configure the alert condition. In this example, the alert triggers when the total device count exceeds 20.
![L3NeTd7nQMfSZ9mI-embedded-image-h16p3ico.png](https://kb.filewave.com/uploads/images/gallery/2023-07/L3NeTd7nQMfSZ9mI-embedded-image-h16p3ico.png)

Add a message that tells recipients what crossed the threshold and what they should check next.

# 5.0 Grafana Plugins

# Plugin Installation

Grafana plugins can add panels, data sources, and visualizations to the FileWave Dashboard.

<p class="callout danger">Install signed plugins only. Plugins found through Grafana's built-in search should already be approved, but plugins can also come from other sources.</p>

## Installation

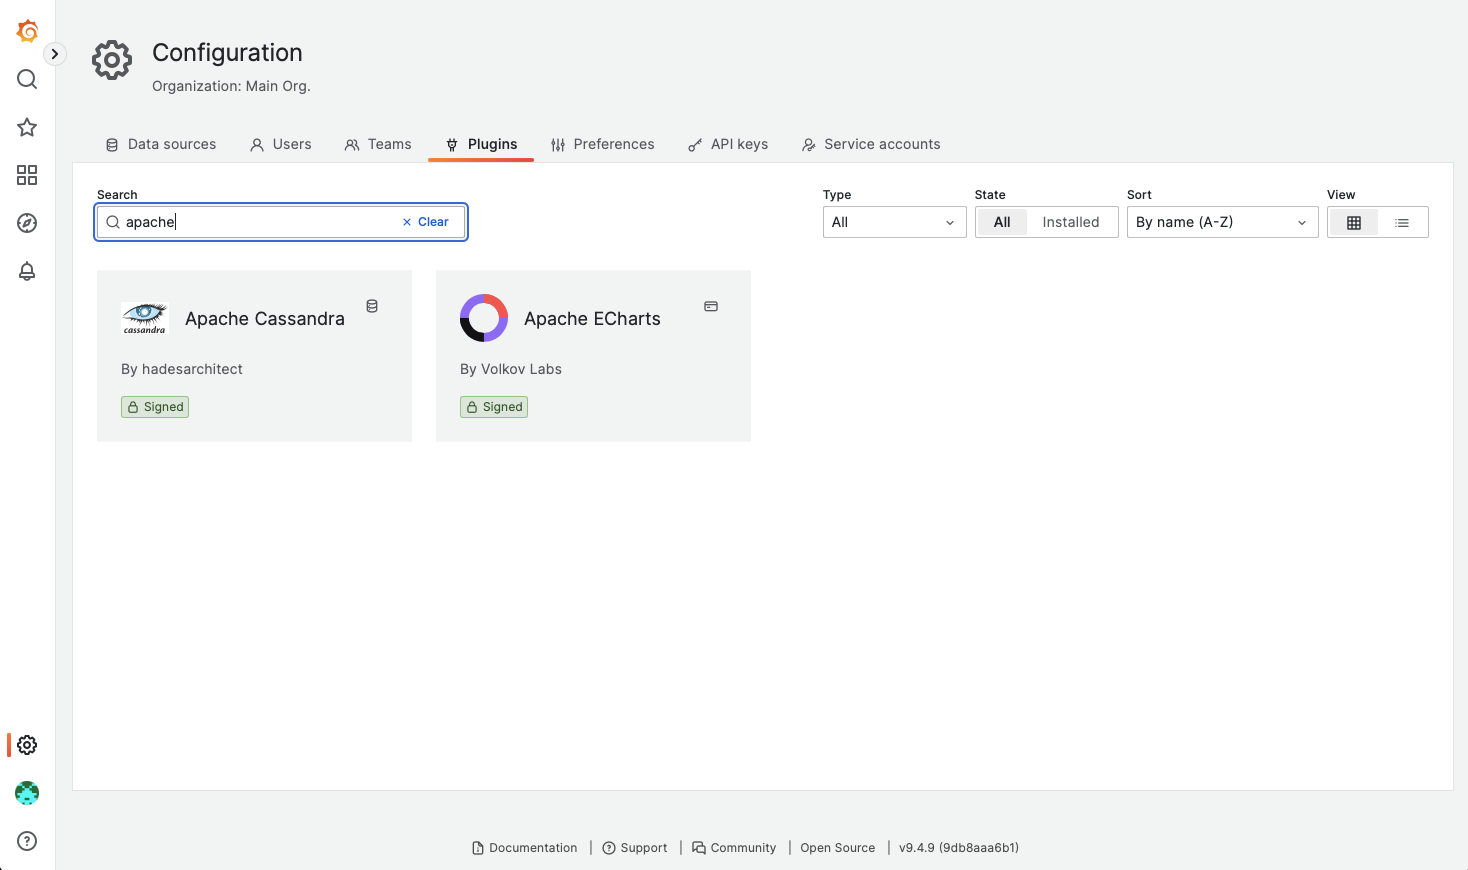
Search for plugins in the Grafana Dashboard under the configuration area.

[![image.png](https://kb.filewave.com/uploads/images/gallery/2023-08/scaled-1680-/71w5kmCEWtTj0ZXd-image.png)](https://kb.filewave.com/uploads/images/gallery/2023-08/71w5kmCEWtTj0ZXd-image.png)
On selecting a plugin though, at the bottom of the description it will indicate necessary permissions are not enabled:

[![image.png](https://kb.filewave.com/uploads/images/gallery/2023-08/scaled-1680-/UIXgou3xmbXe4ul3-image.png)](https://kb.filewave.com/uploads/images/gallery/2023-08/UIXgou3xmbXe4ul3-image.png)
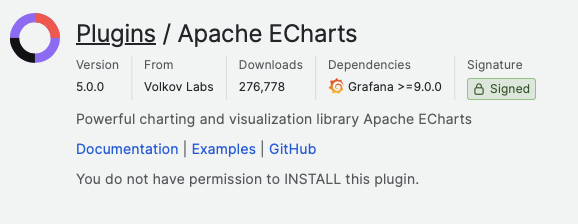
Installing plugins through the Grafana GUI requires Grafana Admin access. FileWave does not allow plugin installation through that path, so install plugins from the command line directly on the server.

### Command Line Installation

The plugin page includes a command-line installation section. Do not copy that command as-is for FileWave, but use it to identify the plugin name required by the FileWave server command.

Taking Apache ECharts as an example:

[![image.png](https://kb.filewave.com/uploads/images/gallery/2023-08/scaled-1680-/I0AYJ9VBWlTMXnre-image.png)](https://kb.filewave.com/uploads/images/gallery/2023-08/I0AYJ9VBWlTMXnre-image.png)
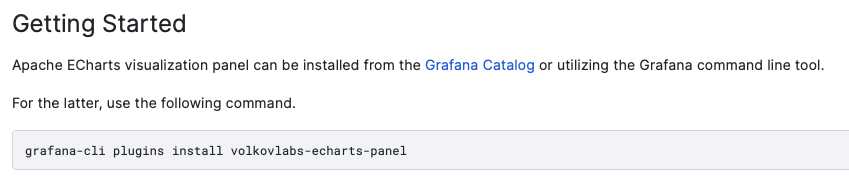
From the description, the plugin name is:

`volkovlabs-echarts-panel`

The command to install this plugin on a FileWave Server would be:

```
/usr/local/sbin/grafana-cli --pluginsDir=/usr/local/filewave/instrumentation_data/grafana/plugins --homepath=/usr/local/filewave/grafana plugins install volkovlabs-echarts-panel
```

The process should report success and the plugin should now be available.

# Plugin Configuration

Some plugins may require additional configuration, e.g. they require reference to additional files. An example of this is the CSV plugin by Marcus Olsson.

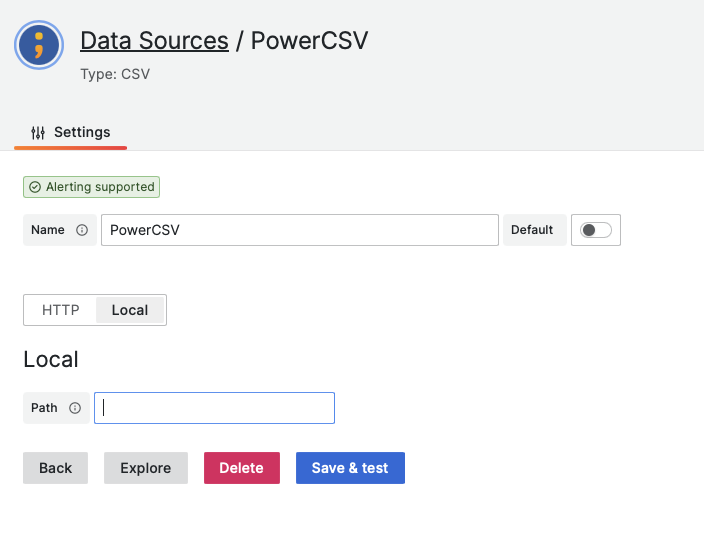
When selecting the CSV Plugin as a Data Source, the path to the CSV file is required, with a choice of HTTP or Local:

[![image.png](https://kb.filewave.com/uploads/images/gallery/2023-08/scaled-1680-/zx2PAZPvFbkbxN4T-image.png)](https://kb.filewave.com/uploads/images/gallery/2023-08/zx2PAZPvFbkbxN4T-image.png)
## Local Data Source

By default, local data sources are not allowed. It is possible to overcome this via the Grafana 'ini' file, however this has limitations.

The FileWave Grafana 'ini' file is defined as:

`/usr/local/etc/filewave/grafana/conf/filewave.ini`

Enablement of Local files is achieved by adding the following into this file:

```
[plugin.marcusolsson-csv-datasource]
allow_local_mode = true
```

After doing so, the server service should be restarted:

```
fwcontrol server restart
```

Local files may now be accessed with this plugin. However, the caveat is that this file is overwritten by the FileWave installer on each upgrade. The outcome is the file must therefore be edited on each upgrade attempt.

### HTTP Data Source

HTTP Data Source has no similar caveat. If there is already an available HTTP share in-house, this could be utilised. However, the FileWave Server could have the apache configuration adapted to include such files.

#### Configure Apache

This process will rely on Apache having access to a directory which serves these files. This could either be one that already exists or configuration could be used to add a new directory to serve just the required files.

<p class="callout success">Recommendation would be to create a new directory.</p>

<p class="callout warning">This is editing FileWave Server files and folders. FileWave upgrades can overwrite files, folders or expansion of product may include new files and folders. Consider using a directory that is unlikely to clash with future updates.</p>

In this example, the new chosen folder is:

`/usr/local/filewave/grafana_plugins_custom/csv`

'grafana\_plugins\_custom' does not yet exist. Rather than just creating one custom plugin folder for all possible plugin use, in this example a subdirectory for the CSV files has been created. Additional plugins that also required http file shares could use the same parent, but have their own subfolder.

The Apache file that can be edited to create new http file shares is:

`/usr/local/filewave/apache/conf/httpd_custom.conf`

As a FileWave Custom file, this will persist with Filewave upgrades.

```
Alias /plugins_custom /usr/local/filewave/grafana_plugins_custom/csv
<Directory "/usr/local/filewave/grafana_plugins_custom/csv">
Options Indexes FollowSymLinks
AllowOverride All
Order allow,deny
Allow from all
</Directory>
```

Full details on each option can be found in the [Apache Documentation](https://httpd.apache.org/docs/2.2/mod/mod_authz_host.html#order)

However, to highlight two key aspects.

##### Directory

This is the newly created directory from which the files may be shared from

##### Alias

When accessing the files from a URL, this is essentially a shortcut for the URL, which will be redirected internally to this folder on access. In this instance, the alias (shortcut link) is:

`/plugins_custom`

<p class="callout info">Other options should be configured as required.</p>

FileWave Server process should be restarted once configured:

```
fwcontrol server restart
```

#### Downloading CSV files

Once configured, CSV files may be populated into the newly created document. For example:

```
# ls -l /usr/local/filewave/grafana_plugins_custom/csv
total 184
-rw-r--r--  1 root  _www  14425 Aug  3 17:06 admin.csv
-rw-r--r--  1 root  _www  19364 Aug  3 17:06 data.csv
-rw-r--r--  1 root  _www  36694 Aug  3 17:06 paint.csv
-rw-r--r--  1 root  _www  19345 Aug  3 17:06 video.csv
```

Test download may be achieved by way of the server URL appended with the alias. For example if the server were called 'demo.filewave.ch', then the URL from the above configuration would be:

`https://demo.filewave.ch/plugins_custom/`

However, a file should be addressed directly. Taking the paint.csv as an example:

`https://demo.filewave.ch/plugins_custom/paint.csv`

Accessing this URL in a browser should show the contents or download the file.

#### Plugin Data Source

Now an Apache share has been created with populated files, a Data Source may be configured to use HTTP for access to the files.

[![image.png](https://kb.filewave.com/uploads/images/gallery/2023-08/scaled-1680-/CRd9APkxQWl3aNsQ-image.png)](https://kb.filewave.com/uploads/images/gallery/2023-08/CRd9APkxQWl3aNsQ-image.png)
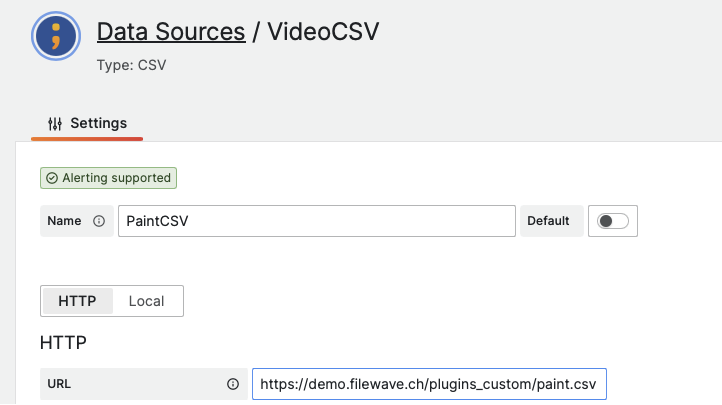
<p class="callout info">Other Data Source settings should be configured as desired.</p>

# Troubleshooting

# Custom Grafana Dashboard - YML Files not being processed

## **What**

A custom Grafana dashboard may stop processing data from YML files after the FileWave API key is regenerated. When that happens, Grafana keeps using the old `bearer_token_file`, so the YML-backed targets cannot authenticate.

## **When/Why**

When you use [3.1.2 Testing the Prometheus Scrape](https://kb.filewave.com/books/dashboard-grafana/page/312-testing-the-prometheus-scrape "3.1.2 Testing the Prometheus Scrape") while setting up a custom Dashboard with a YML file, the targets may show “DOWN,” as shown below. Dashboard widgets that depend on those targets will not populate.
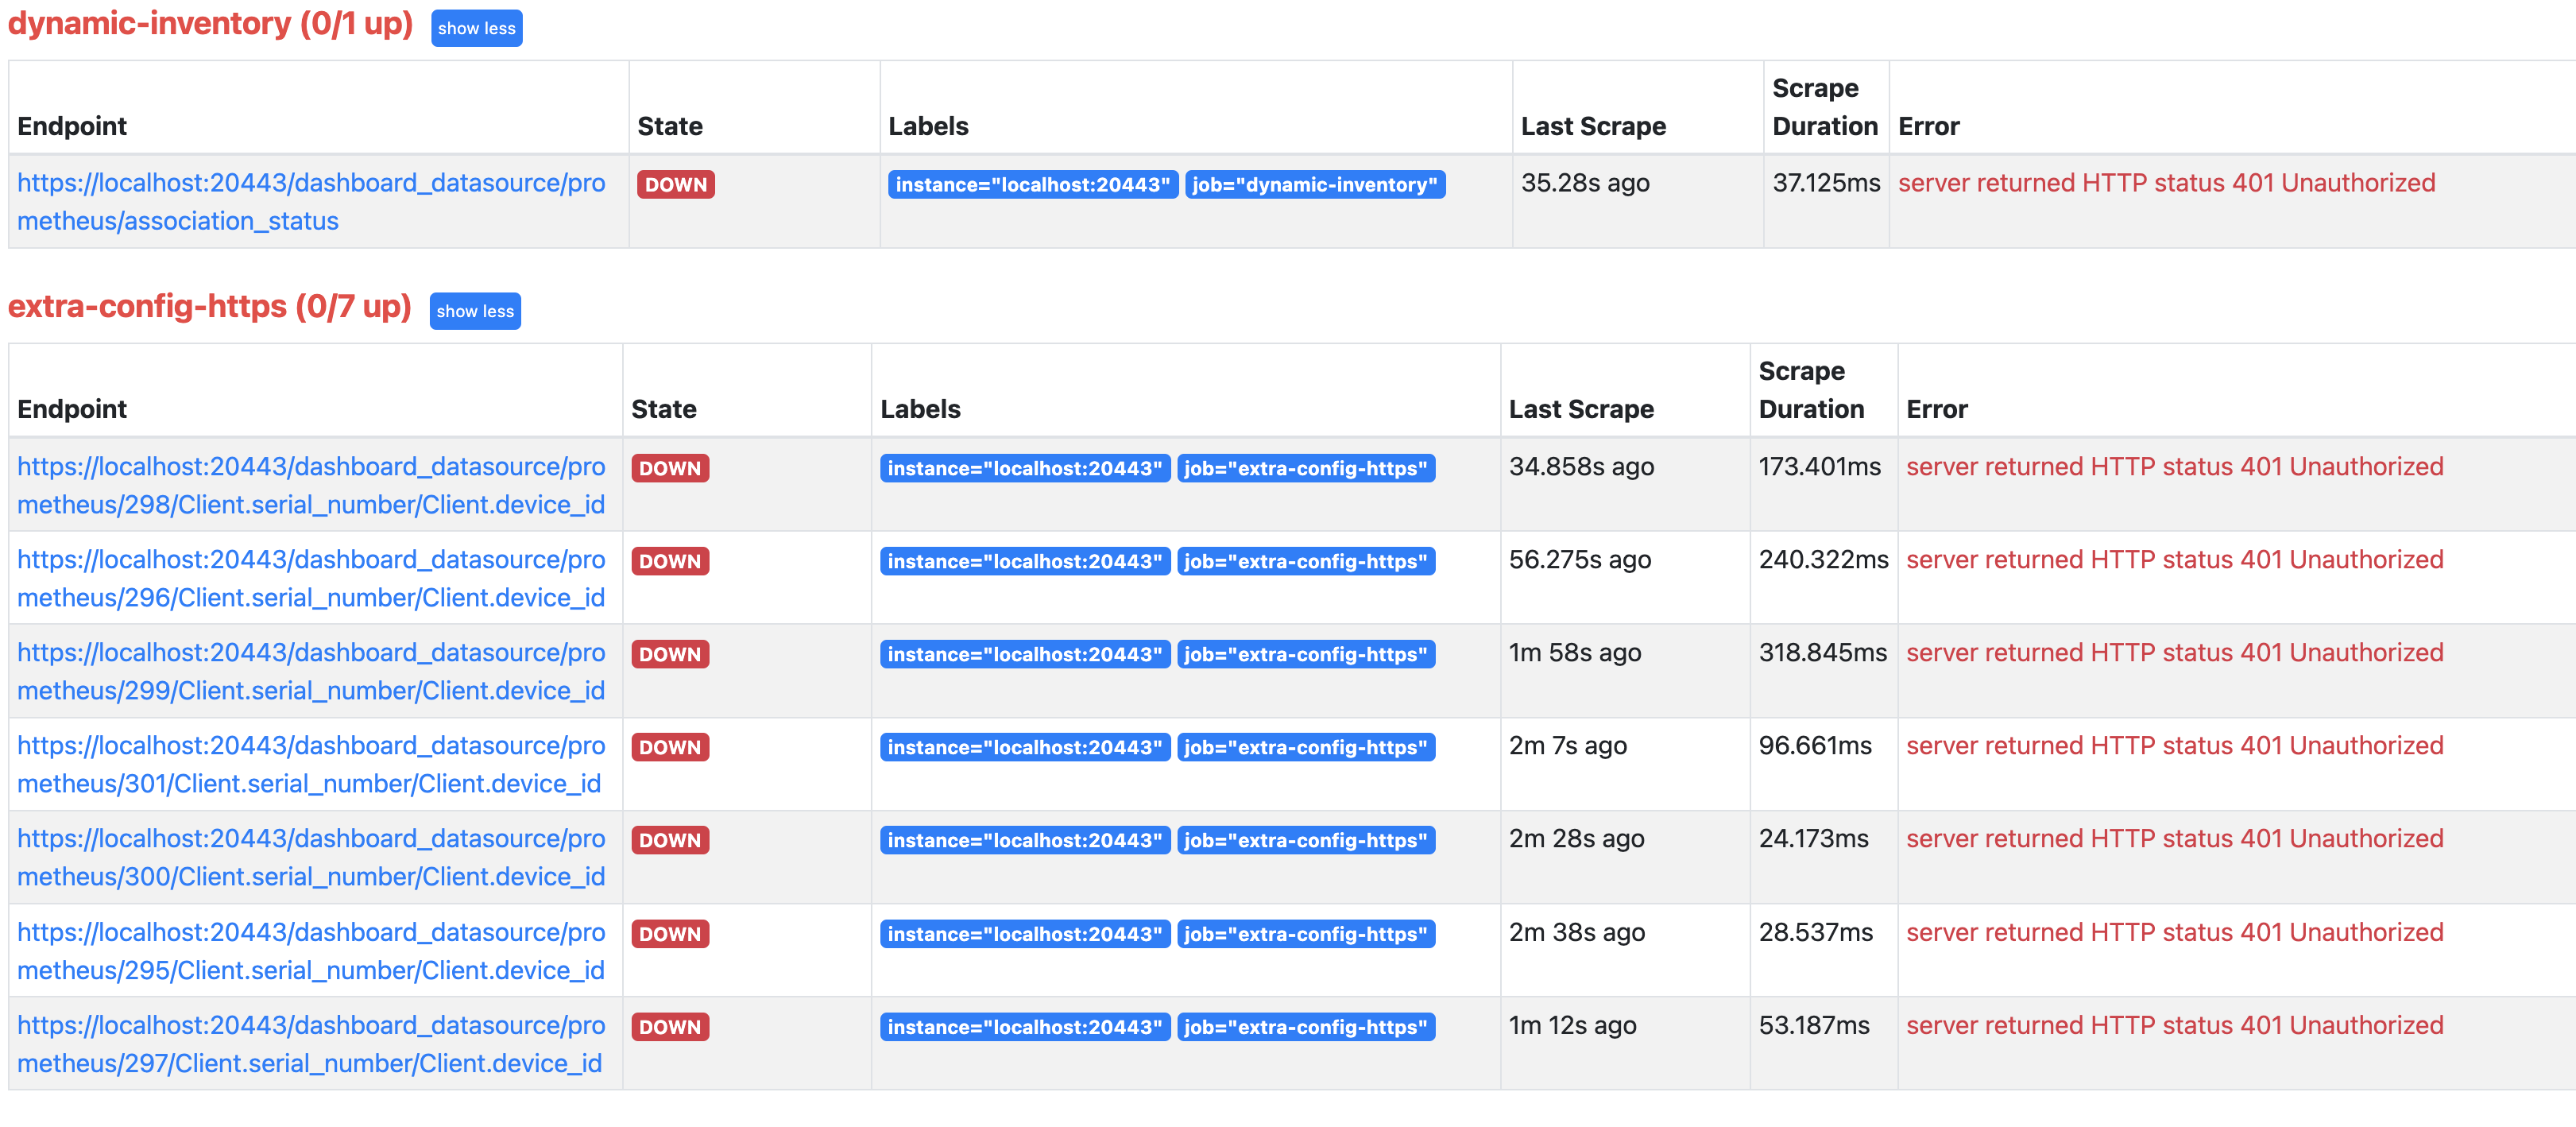
![grafana broken.png](https://kb.filewave.com/uploads/images/gallery/2023-06/n8Jtzq4xE1K1qoyo-grafana-broken.png)

## **How**

To fix this, SSH to the FileWave Server and remove `bearer_token_file`. Restart FileWave Server so it regenerates the file with the current API key. Hosted customers should contact FileWave Support; support often handles custom YML uploads and can remove the file for you.

```
rm /usr/local/etc/filewave/prometheus/conf.d/bearer_token_file
/usr/local/bin/fwcontrol server restart
```

# Resolving “Login failed: User sync failed” Error in Grafana

## What

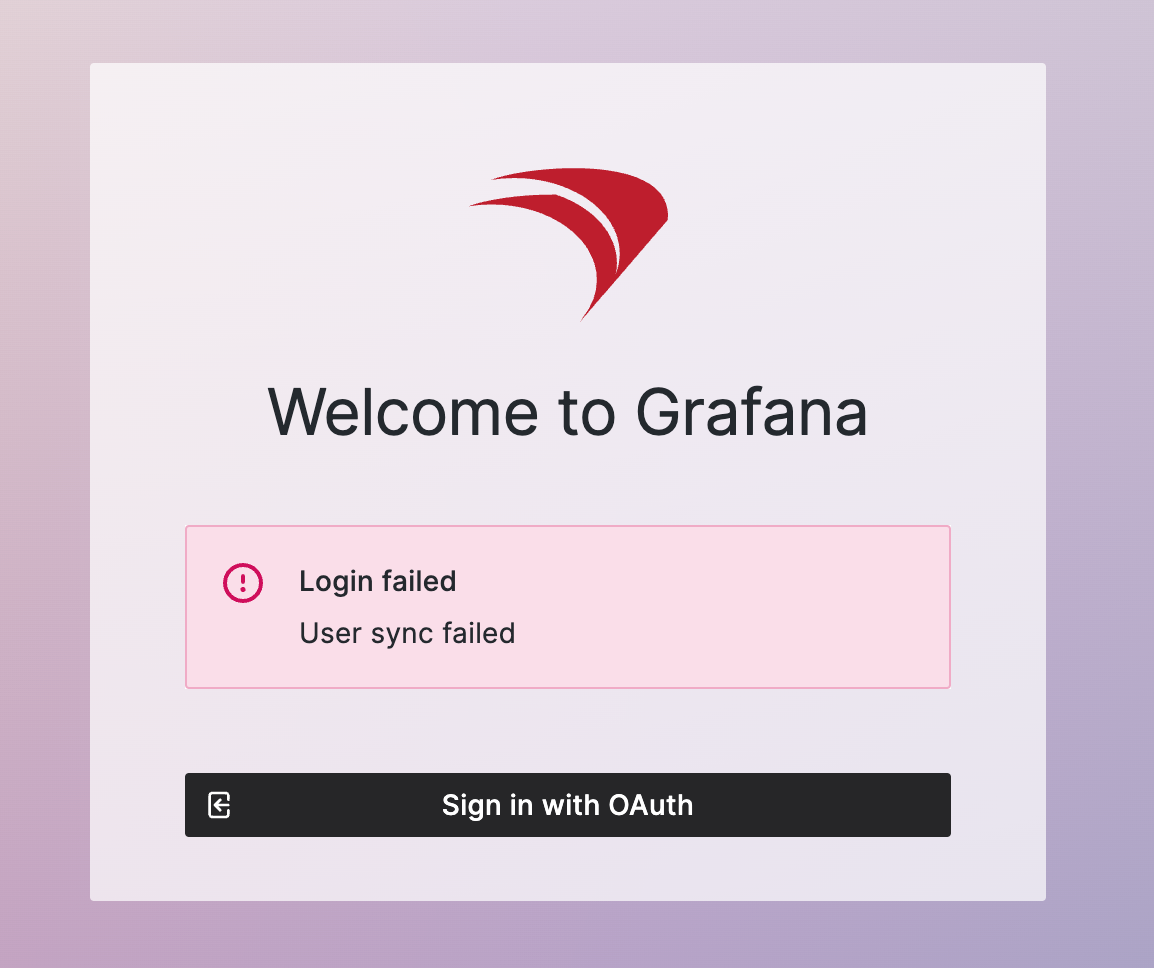
This article explains how to resolve the “Login failed: User sync failed” error when an administrator signs in to the FileWave Dashboard through Grafana.

[![Grafana login failed user sync failed error](https://kb.filewave.com/uploads/images/gallery/2024-06/scaled-1680-/9oGAS9jainT09TCk-image.png)](https://kb.filewave.com/uploads/images/gallery/2024-06/9oGAS9jainT09TCk-image.png)
## When/Why

This error occurs when a FileWave administrator account uses a username that conflicts with Grafana. The most common case is a FileWave Central administrator named “admin”, since Grafana also uses an internal “admin” account. The conflict can appear when that administrator tries to open the FileWave Dashboard through Grafana.

## How

Avoid using “admin” as a FileWave administrator username. Use the steps below for a built-in administrator account. If the affected administrator comes from [LDAP](https://kb.filewave.com/books/identity-provider-idp-integration/page/use-ldap-groups-for-filewave-central-administrator-access "LDAP Admin Integration") or an [IdP](https://kb.filewave.com/books/identity-provider-idp-integration/page/admin-login-using-an-idp-provider "Admin Login in Using an IdP Provider"), rename or adjust the account in that identity source instead.

1. <span class="s1"> </span>**Access FileWave Central:**
    - Open FileWave Central.
    - Navigate to Preferences<span class="s2"> -&gt; </span>Manage Administrators<span class="s2">.</span>
2. **Rename the “admin” Account:**
    - Identify if an “admin” user exists.
    - Rename this user to a specific named account, such as a real administrator name.
    - Ensure the new username is unique and does not conflict with other system usernames.
3. **Create Named Accounts:**
    - Create individual named accounts for each administrator.
    - Named administrator accounts help prevent this Grafana conflict and make audit trails easier to understand.
4. **Update Login Credentials:**
    - Inform administrators whose usernames changed.
    - Update any saved login credentials in browsers or password managers accordingly.

## Related Links

- [Managing FileWave Administrators](https://kb.filewave.com/books/filewave-central-anywhere/page/managing-filewave-administrators "Managing FileWave Administrators")

## Digging Deeper

Grafana uses a default “admin” account during initial setup. If FileWave also has an administrator named “admin”, Grafana user synchronization can fail because the username is already reserved or in use.

Named accounts also improve accountability because administrator activity can be tied to a person instead of a shared generic login.

For FileWave administrator-account setup, see the related administrator-management article above.