This workflow requires file-system access to a self-managed FileWave Server. Hosted FileWave customers should contact FileWave Technical Support for server-side configuration changes.
## Configuration location Save custom YAML jobs in `/usr/local/etc/filewave/prometheus/conf.d/jobs/https` on the FileWave Server. Prometheus reads jobs from this directory automatically. Sample jobs are available in `/usr/local/etc/filewave/prometheus/conf.d/jobs`. Copy the closest sample and edit it carefully. YAML indentation is significant, and the report must include every field used for counting or grouping.| Step | Example |
| 1. Copy a sample YAML file into `/usr/local/etc/filewave/prometheus/conf.d/jobs/https` and give it a meaningful name. | 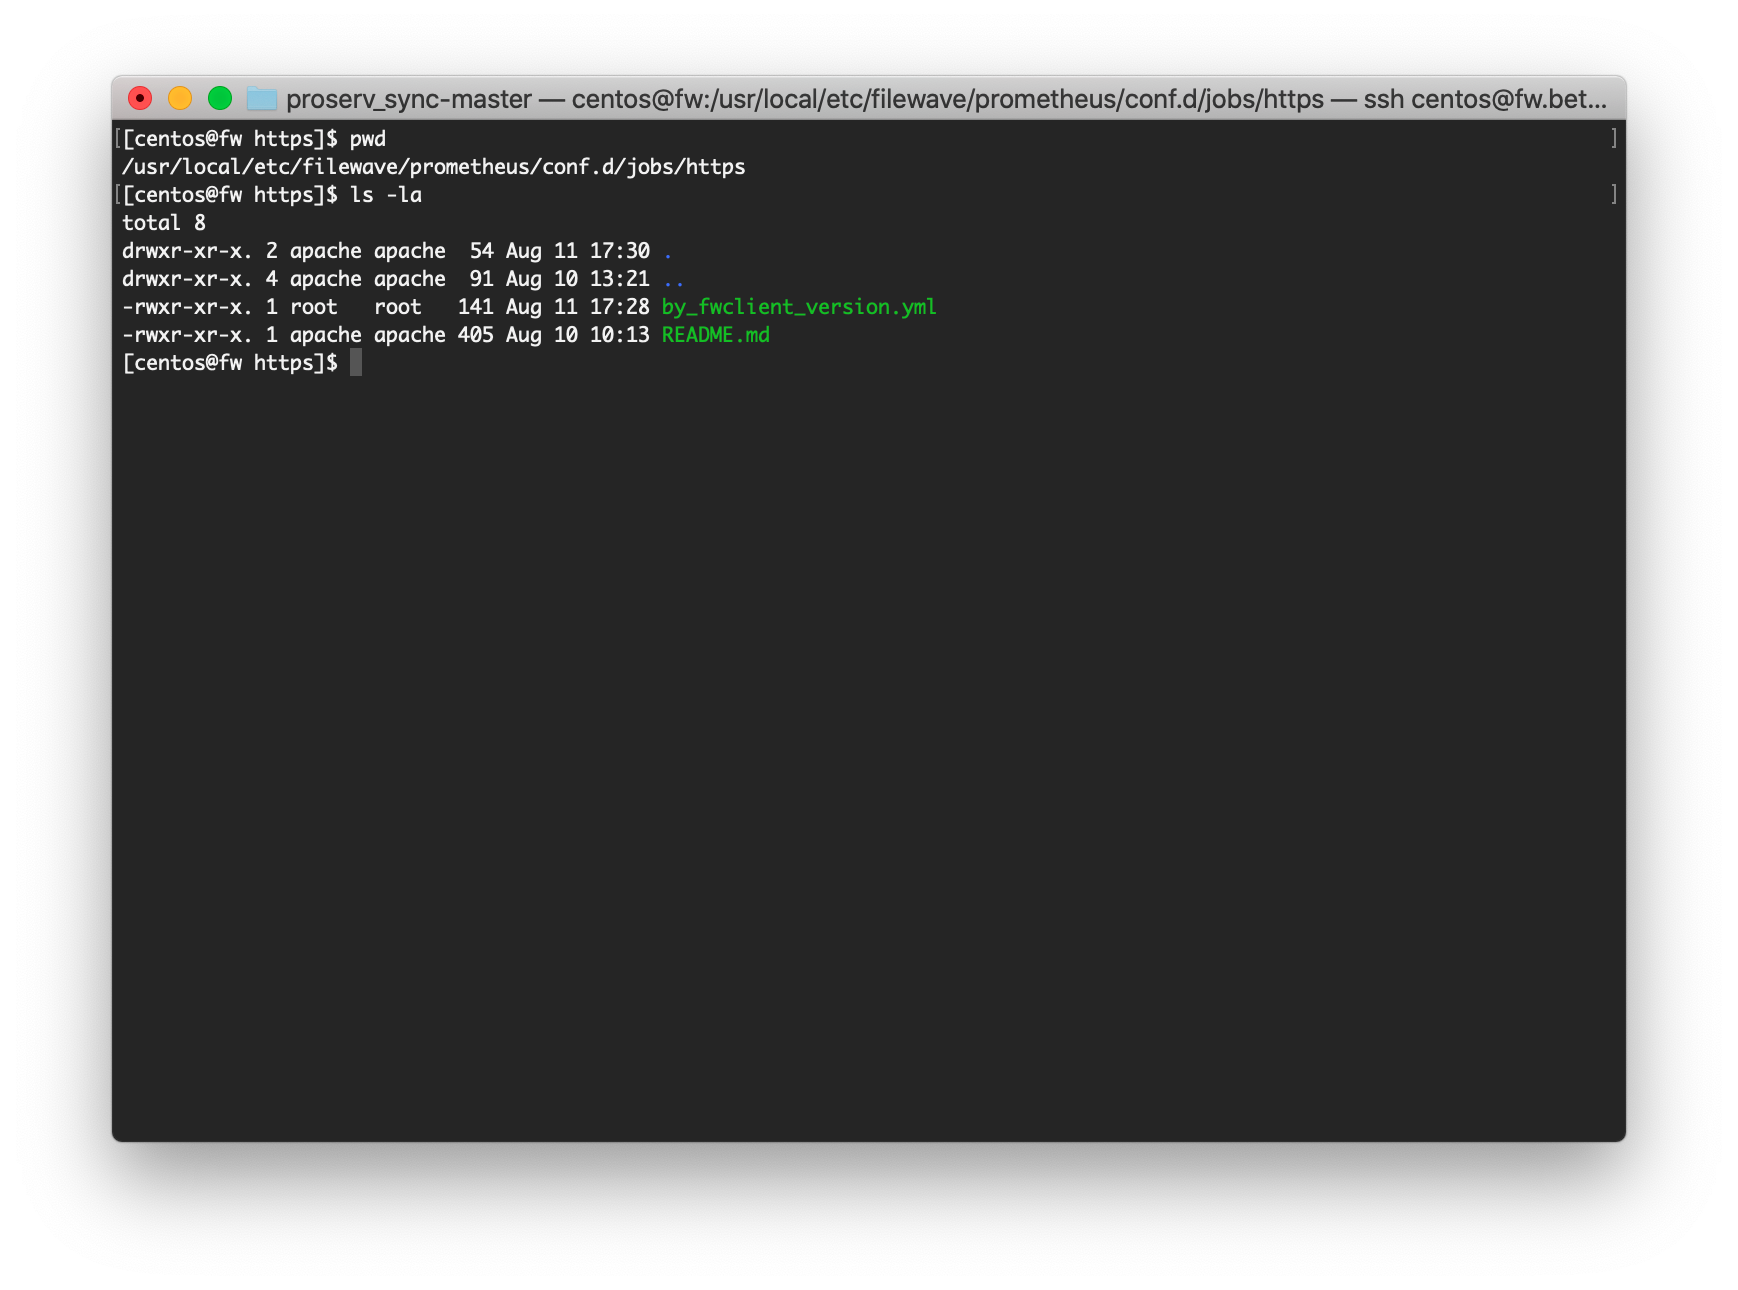 |
| 2. Choose three values for the job:- The Inventory Report to read. - The field to count. `device_id` is a common choice when counting devices. - The field to group by, such as FileWave Client version. | |
| 3. Open the Inventory Report and note its report ID. Confirm that the report includes the count field and the field you will group by. | 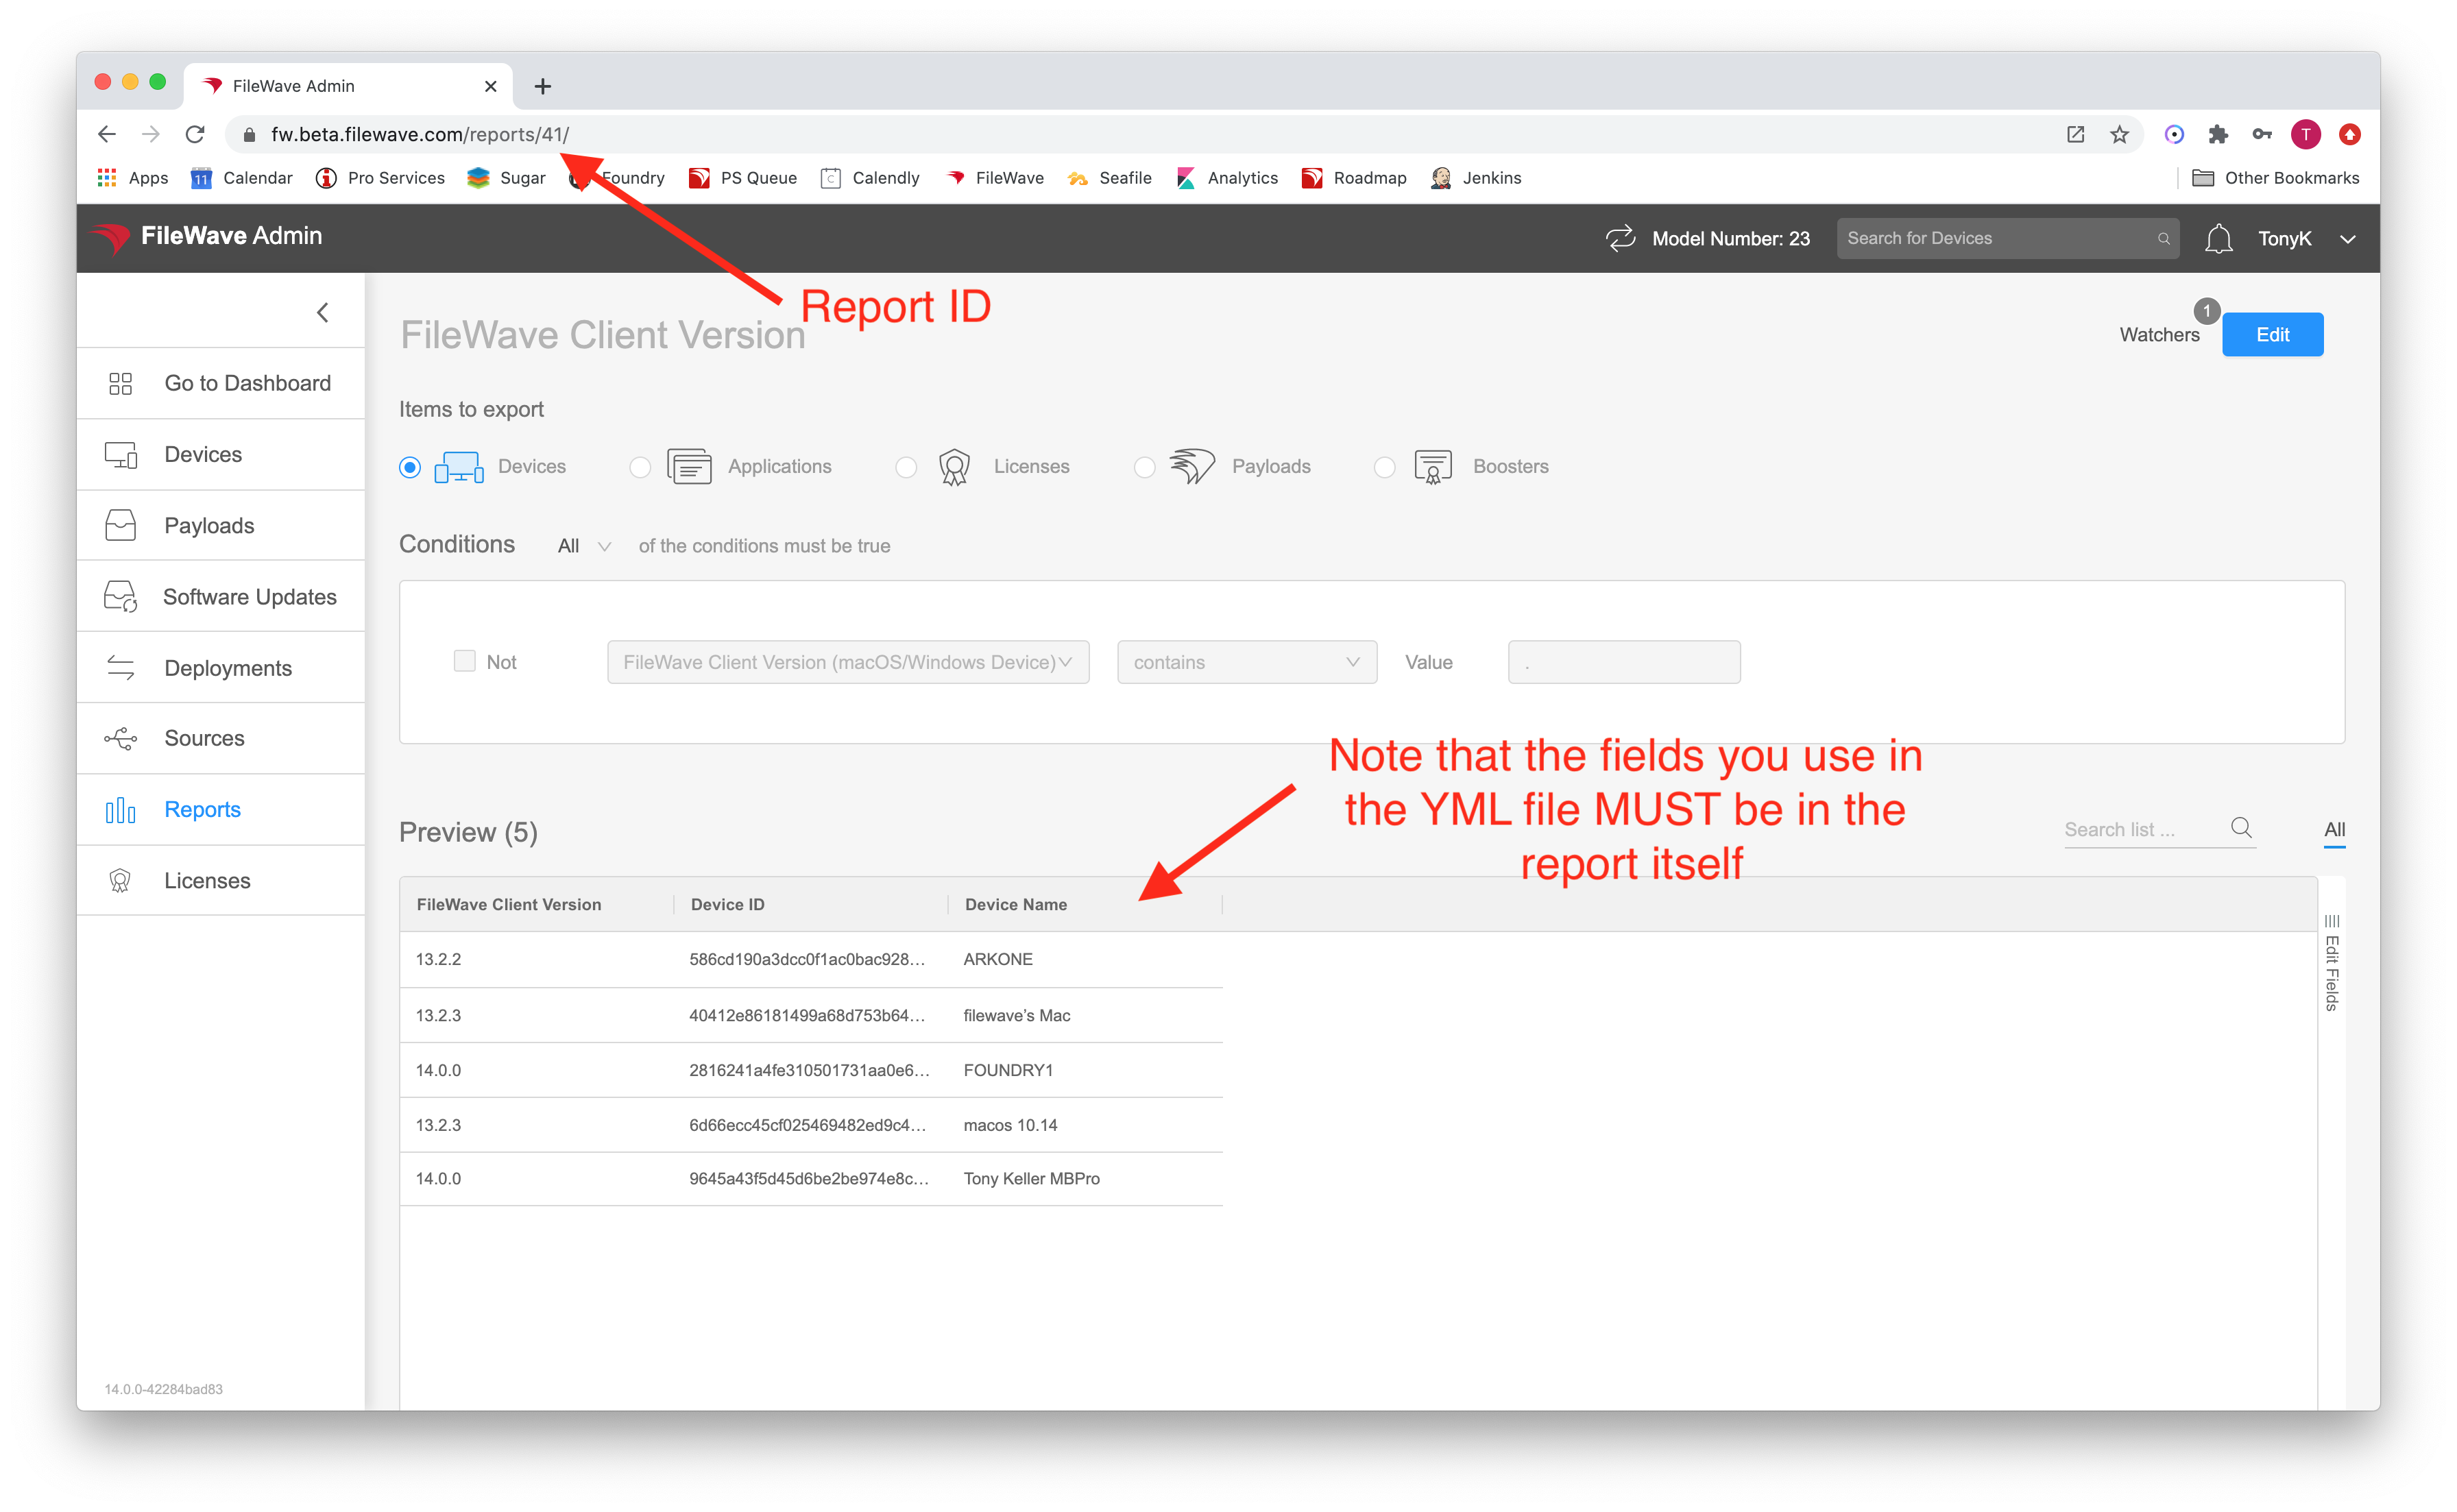 |
| 4. Get the definition for the fields you want to use from the API...the easiest way is to do a curl from the command line like this:
`bash curl -s -k -H "Authorization: ` Make sure and substitute in your values for the <Base64\_API\_Token>, <my.server.address> and <report\_id> You'll get a response that includes the component and the field names as shown at right | 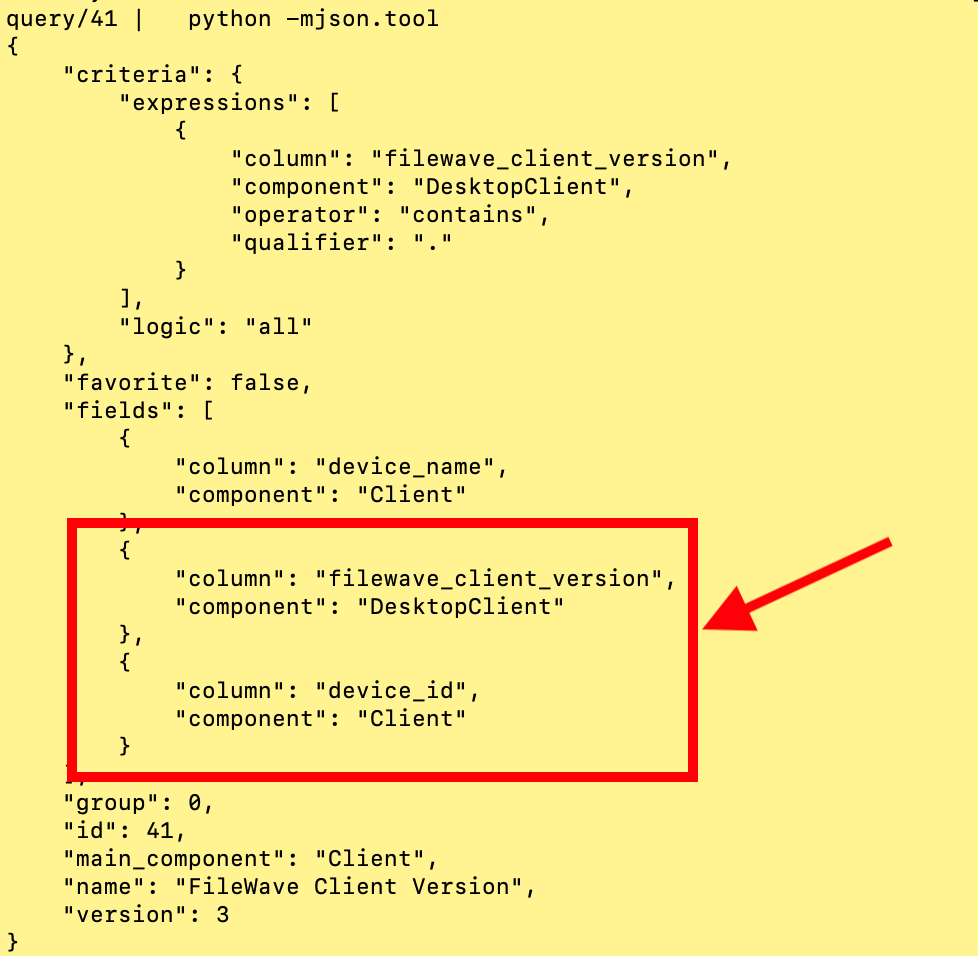 |
| 5. Edit the YAML job with the report ID, count field, and grouping field, then save it. When starting from the sample, remove the leading `#` only from the lines you intend to enable. | 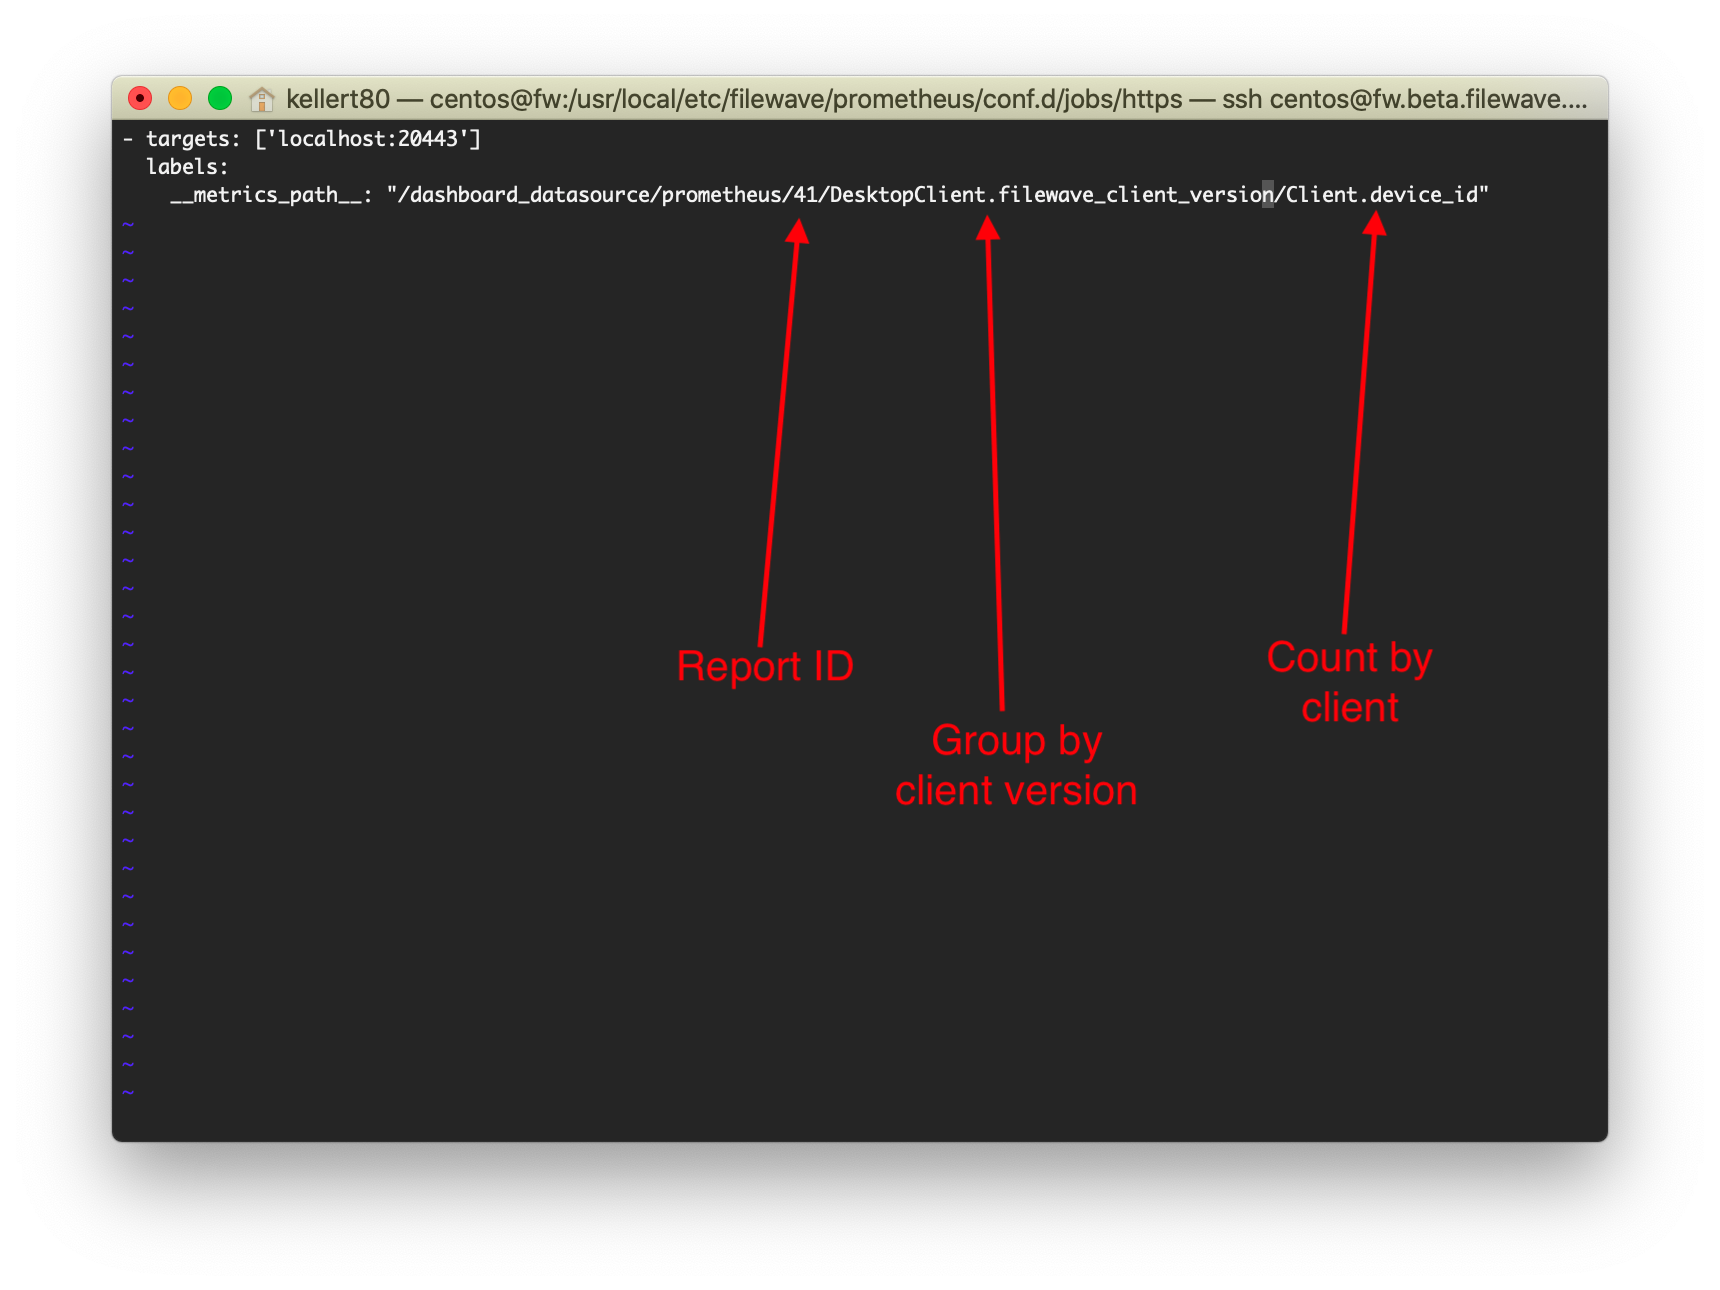 |