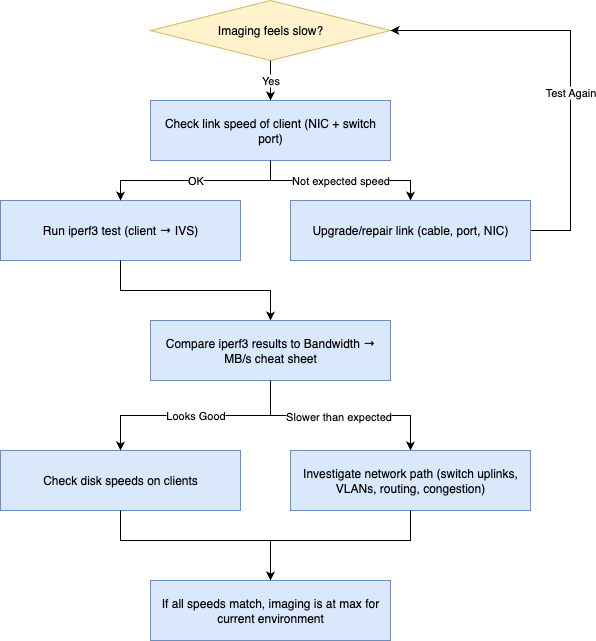
# Imaging Speed Test for IVS Performance Verification
## What
When imaging Windows devices from a FileWave Image Virtualization Server (IVS), it’s important to ensure that data transfer speeds are optimal. Bottlenecks can occur if the IVS and client devices are on different subnets, or if network links between them are not operating at full capacity.
Two tools—**iftop** and **iperf3**—can help diagnose and measure network performance for imaging.
Note that if stunnel is enabled then there is some additional bandwidth used for the encrypted tunnel. You can [disable stunnel](https://kb.filewave.com/books/network-imaging-ivs/page/windows-imaging-in-filewave-secure-imaging-option-155 "Windows Imaging in FileWave 15.5+: Secure NFS Tunneling and Fallback Options") for better performance.
## When/Why
You might use these tests when:
- Imaging feels slower than expected.
- Clients are located across multiple switches or VLANs.
- You want to validate performance before imaging large batches of devices.
- You need to confirm whether a slowdown is due to the network, the IVS, or client hardware.
## How
#### 1. Measuring Real-Time Traffic with iftop
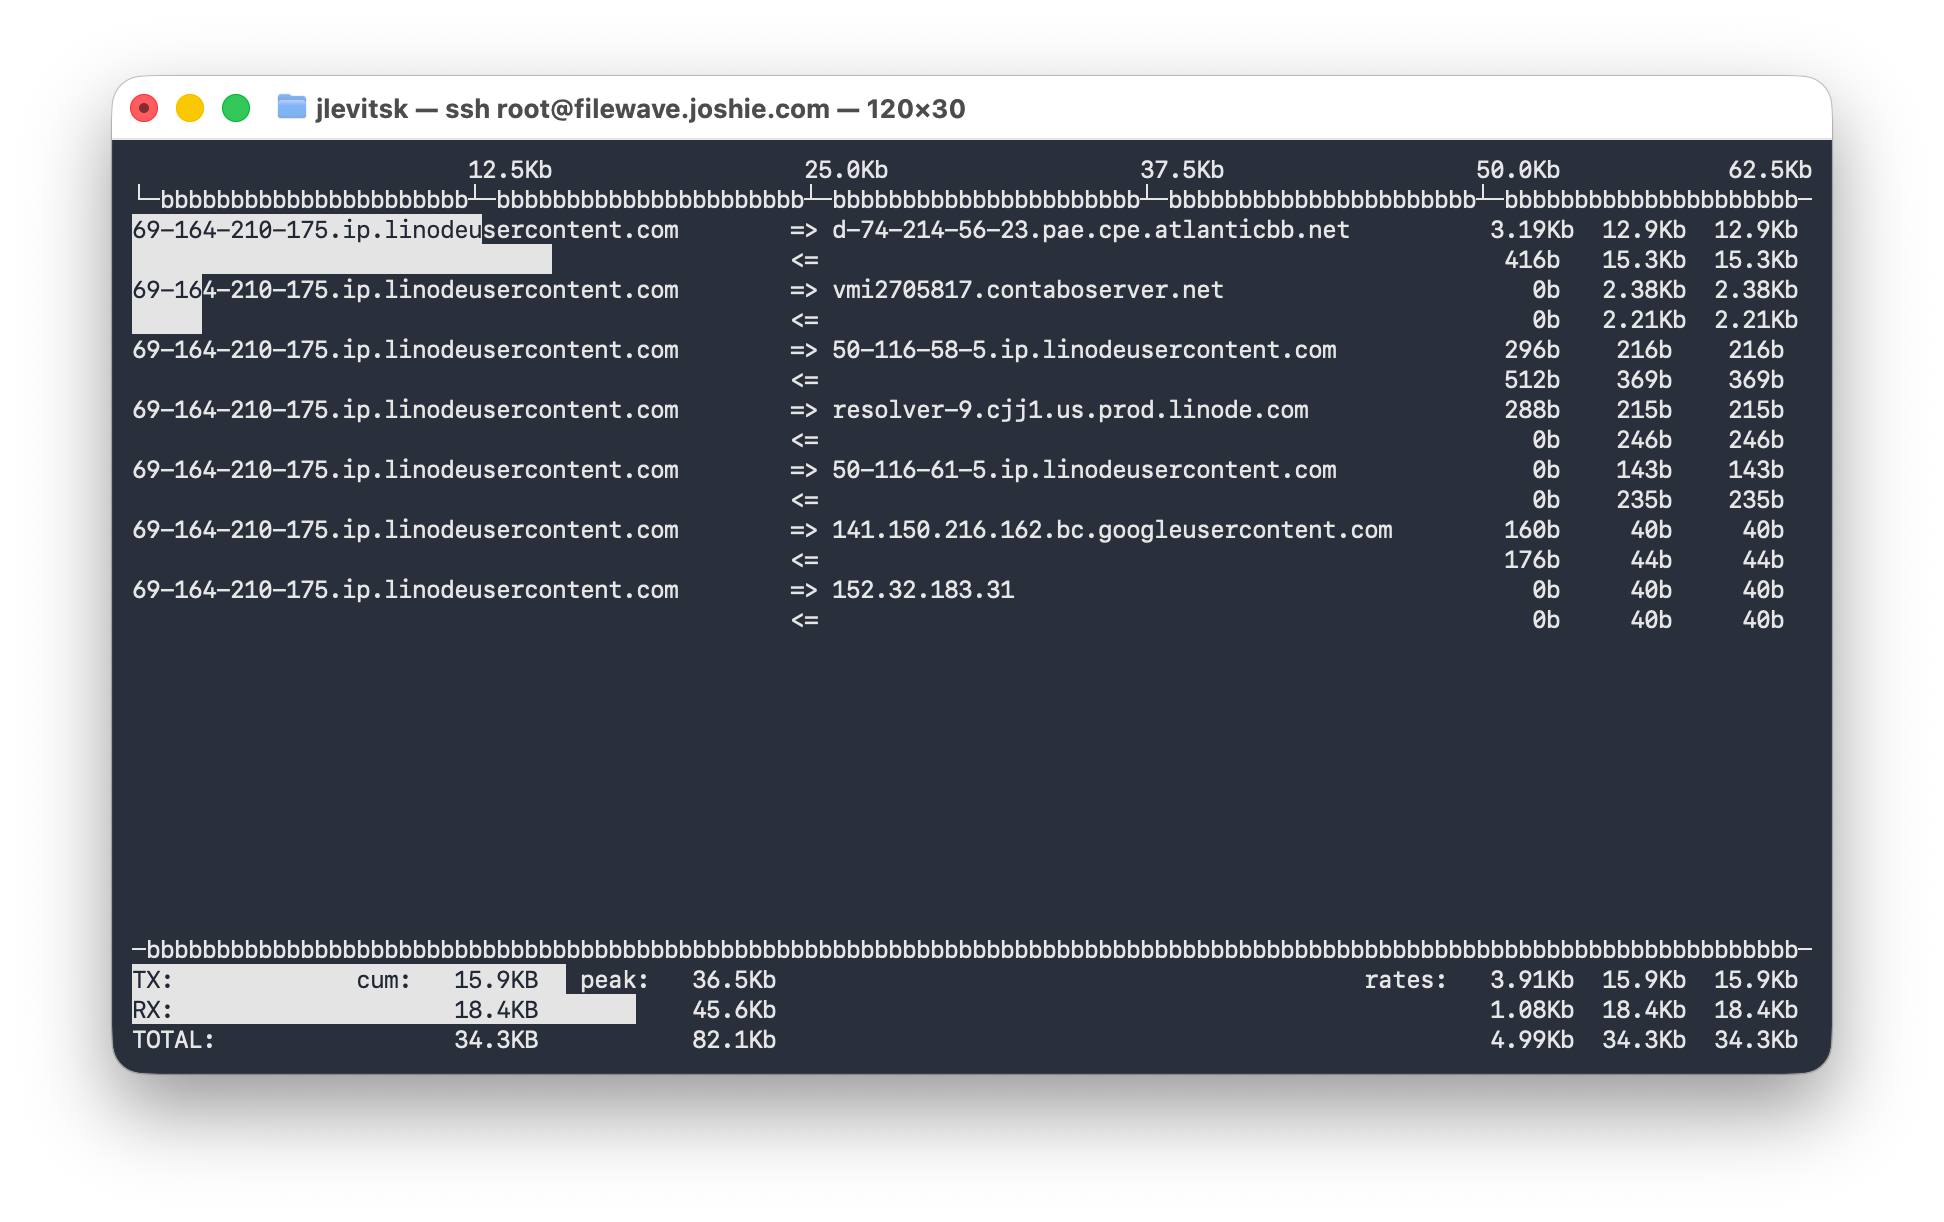
iftop can show live network traffic on the IVS.
Install and run it on the IVS:
Note that in FileWave 16.2.0+ this is already installed on the IVS so you will not need to do the apt install command below.
```
sudo apt install iftop
sudo iftop
```
[](https://kb.filewave.com/uploads/images/gallery/2025-08/kk5shrAnjlR2Qa0z-image.png)
The first column will be the server you are running iftop on. The second column will show you the devices connected so if I was imaging 152.32.183.31 then that would be the last entry on the screen and the first line is traffic TO that host and the second is traffic FROM that host as indicated by the arrows.
**Understanding the three traffic columns in iftop:**
- **Left column:** Average traffic rate over the last 2 seconds.
- **Middle column:** Average traffic rate over the last 10 seconds.
- **Right column:** Average traffic rate over the last 40 seconds.
You can use this to see per-client speeds during imaging and spot if a client is receiving data more slowly than others.
---
#### 2. Load Testing with iperf3
iperf3 simulates network traffic to measure throughput between the IVS and a client device.
Install on the IVS:
Note that in FileWave 16.2.0 the IVS already installs iperf3 so you may not need to do the install and systemctl commands below.
The second line below is only needed if you picked "No" to running iperf as a service and will set it to be a service.
```
sudo apt install iperf3
sudo systemctl enable --now iperf3
sudo ufw allow 5201/tcp
```
Note that [iperf3 listens on TCP 5201](https://kb.filewave.com/books/filewave-general-info/page/default-tcp-and-udp-port-usage "Default TCP and UDP Port Usage") so make sure that from your clients you can reach the IVS on that port and you don't have a firewall blocking that port.
**On the client side (macOS, Windows, or Debian)**:
As of FileWave 16.2.0 the IVS has iperf3 already included in the OS that boots on a client when PXE booting. To test you just need to put the IVS in debug mode and then boot a client to be imaged. In debug mode that client will boot to a unix shell instead of imaging or capturing. From there you can use the following command to test;
1. Enable debug on IVS;
```bash
sudo touch /etc/fw_master_debug
sudo reboot
```
2\. Command to type on the PXE booted client when in debug;
Note that in tbe below command the 5 is the number of connections and 30 is the duration to test. This would simulate 5 clients for 30 seconds. You can change the number and duration to do more extensive testing.
```bash
network-test 5 30
```
3\. Disable debug on IVS once you are done with testing;
```
sudo rm -f /etc/fw_master_debug
sudo reboot
```
Other than testing via a client in debug mode you would need to first install iperf3. This can be found for Windows here: [https://iperf.fr/iperf-download.php](https://iperf.fr/iperf-download.php) and for Debian can be installed with "sudo apt install iperf3" and for macOS can be installed via [Homebrew](https://brew.sh/) with "brew install iperf3". On macOS many admins will already have Homebrew installed, but it can take a few minutes to install it if not.
```
iperf3 -c -P -t
```
- <IVS\_IP>: IP address of the IVS.
- -P: Number of parallel connections (e.g., 1 for a single client, 20 to simulate 20 machines).
- -t: Duration in seconds for the test.
Example:
```
iperf3 -c 192.168.1.50 -P 10 -t 30
```
Tests 10 parallel streams for 30 seconds.
---
#### 3. Bandwidth → MB/s Cheat Sheet
*(Real-world speeds will be ~10–15% less due to protocol overhead, duplex negotiation, etc.)*
| **Network Speed**
| **Theoretical MB/s**
| **Real-World MB/s (approx.)**
|
| 1 Gb | 125 MB/s | 105-115 MB/s |
| 2.5 Gb | 312.5 MB/s | 265-285 MB/s |
| 5 Gb | 625 MB/s | 525-565 MB/s |
| 10 Gb | 1250 MB/s | 1050-1150 MB/s |
---
#### 4. Using Results to Predict Imaging Times
Once you know your average throughput from iperf3, you can estimate imaging time.
##### **Example 1: 1 Gb Network Connection**
- Image: **10 GB**
- Driver pack: **3 GB**
- Total data: **13 GB**
- 1 Gb link ≈ **110 MB/s real-world**
**Calculation:**
13 GB ÷ 110 MB/s ≈ **118 seconds** (~2 minutes) per machine.
For 10 machines (unicast), ≈ **20 minutes** (plus minor overhead).
##### **Example 2: 10 Gb Network Connection**
- Image: **10 GB**
- Driver pack: **3 GB**
- Total data: **13 GB**
- 10 Gb link ≈ **1100 MB/s real-world**
**Calculation:**
13 GB ÷ 1100 MB/s ≈ **12 seconds** per machine.
For 10 machines (unicast), ≈ **2 minutes** total.
---
#### Expected Imaging Times by Network Speed
*(Assumes 13 GB total image + drivers per machine, real-world throughput values, unicast imaging)*
| **Network Speed**
| **Real-World Throughput**
| **1 Machine Time**
| **10 Machines Time**
| **20 Machines Time**
|
| 1 Gb | ~110 MB/s | ~2 min | ~20 min | ~40 min |
| 2.5 Gb | ~275 MB/s | ~47 sec | ~8 min | ~16 min |
| 5 Gb | ~550 MB/s | ~24 sec | ~4 min | ~8 min |
| 10 Gb | ~1100 MB/s | ~12 sec | ~2 min | ~4 min |
**Additional Notes:**
- Always consider the slowest link: client NIC speed, switch port speed, uplinks between switches, and IVS NIC speed.
- Avoid hubs—always use switches.
- Different VLANs and routing hops may reduce performance.
## Related Content
- [Setting up the IVS (Imaging Virtual Server)](https://kb.filewave.com/books/network-imaging-ivs/page/setting-up-the-ivs-imaging-virtual-server "Setting up the IVS (Imaging Virtual Server)")
- [IVS Control Commands](https://kb.filewave.com/books/network-imaging-ivs/page/ivs-control-commands "IVS Control Commands")
## Digging Deeper
- You can combine iftop and iperf3 results: run iperf3 load tests while monitoring iftop to see how the IVS reports real-time speeds.
- For imaging 50+ devices, consider deploying a local IVS in each subnet to avoid bottlenecks.
- Remember that hard drives (HDD vs. SSD) in client devices also impact the *perceived* imaging speed—network speed is only one part of the chain.
- If speeds are significantly below expected values, investigate:
- Duplex mismatches on switch ports.
- Outdated NIC drivers on clients.
- Oversubscribed uplinks between switches.