
3.1.1 Group FileWave Report Data with Prometheus
What this does
InPrometheus ordercan aggregate fields from a FileWave Inventory Report so Grafana can display rollout counts, client-version summaries, and other grouped results.
When to douse summaryit
Create wea needcustom Prometheus scrape job when a Grafana panel needs a count grouped by a field in an existing Inventory Report.
This workflow requires file-system access to leveragea theself-managed powerFileWave ofServer. Prometheus.Hosted FileWave customers should contact FileWave Technical Support for server-side configuration changes.
When/WhyConfiguration location
AnytimeSave wecustom wantYAML to do something like report on a rollout or general status, we are going to want to summarize a report. We will accomplish this by using a Prometheus config file on the FileWave server itself.
How
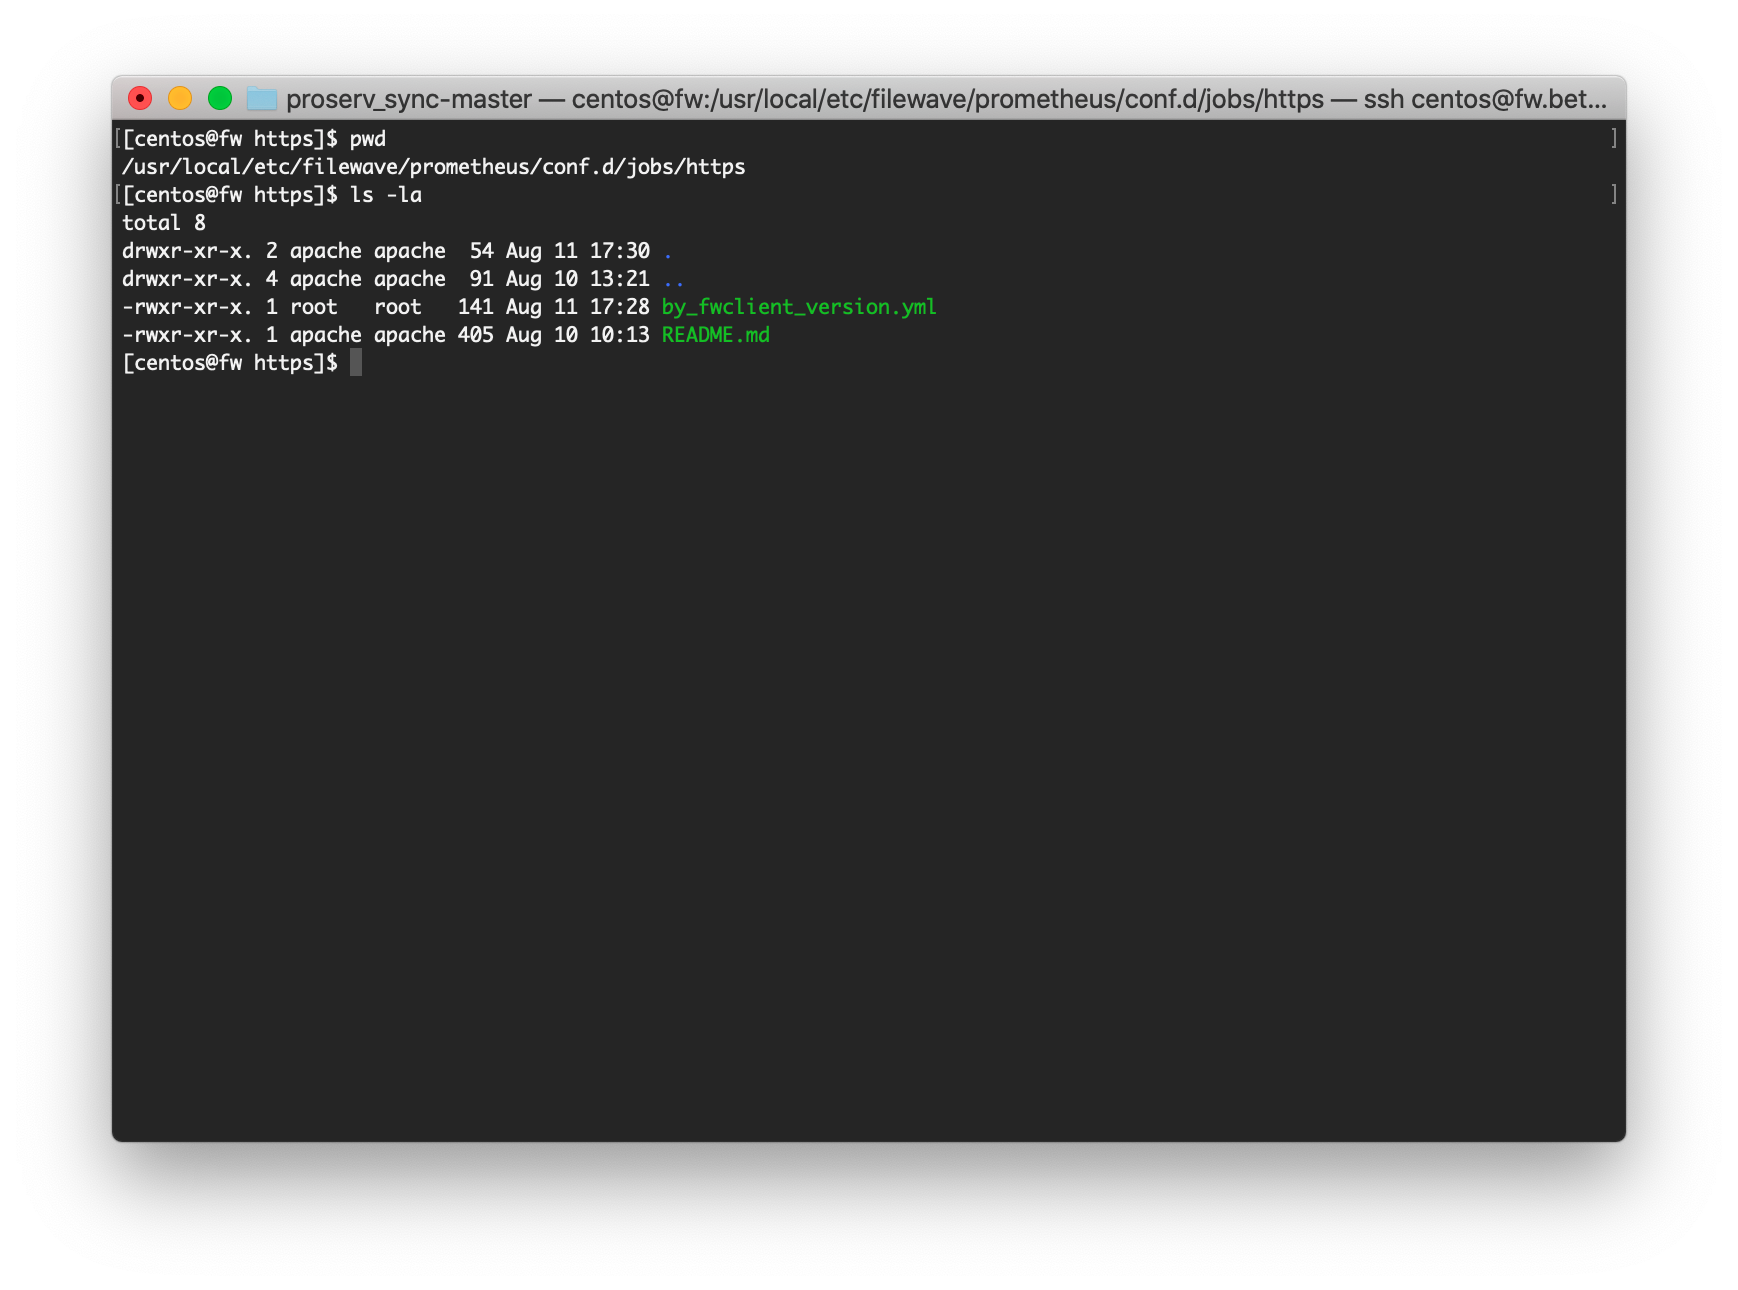
The configuration (or yml files) that we'll create will always be placedjobs in the /usr/local/etc/filewave/prometheus/conf.d/jobs/https on the FileWave directoryserver.Server. Prometheus Anythingreads placedjobs infrom this directory willautomatically. automaticallySample bejobs readare by Prometheus, and the data presented to our dashboard. (Example yml files can be foundavailable in /usr/local/etc/filewave/prometheus/conf.d/.jobs)jobs
TheCopy syntaxthe ofclosest thesesample filesand edit it carefully. YAML indentation is quite picky, so it is best to copy an existing one,significant, and then modify it. It may seem complicated, but we are always going to do the followingreport steps:must include every field used for counting or grouping.
| Step | Example |
1. /usr/local/etc/filewave/prometheus/conf.d/jobs/https |
  |
2.
|
|
| 3. |
 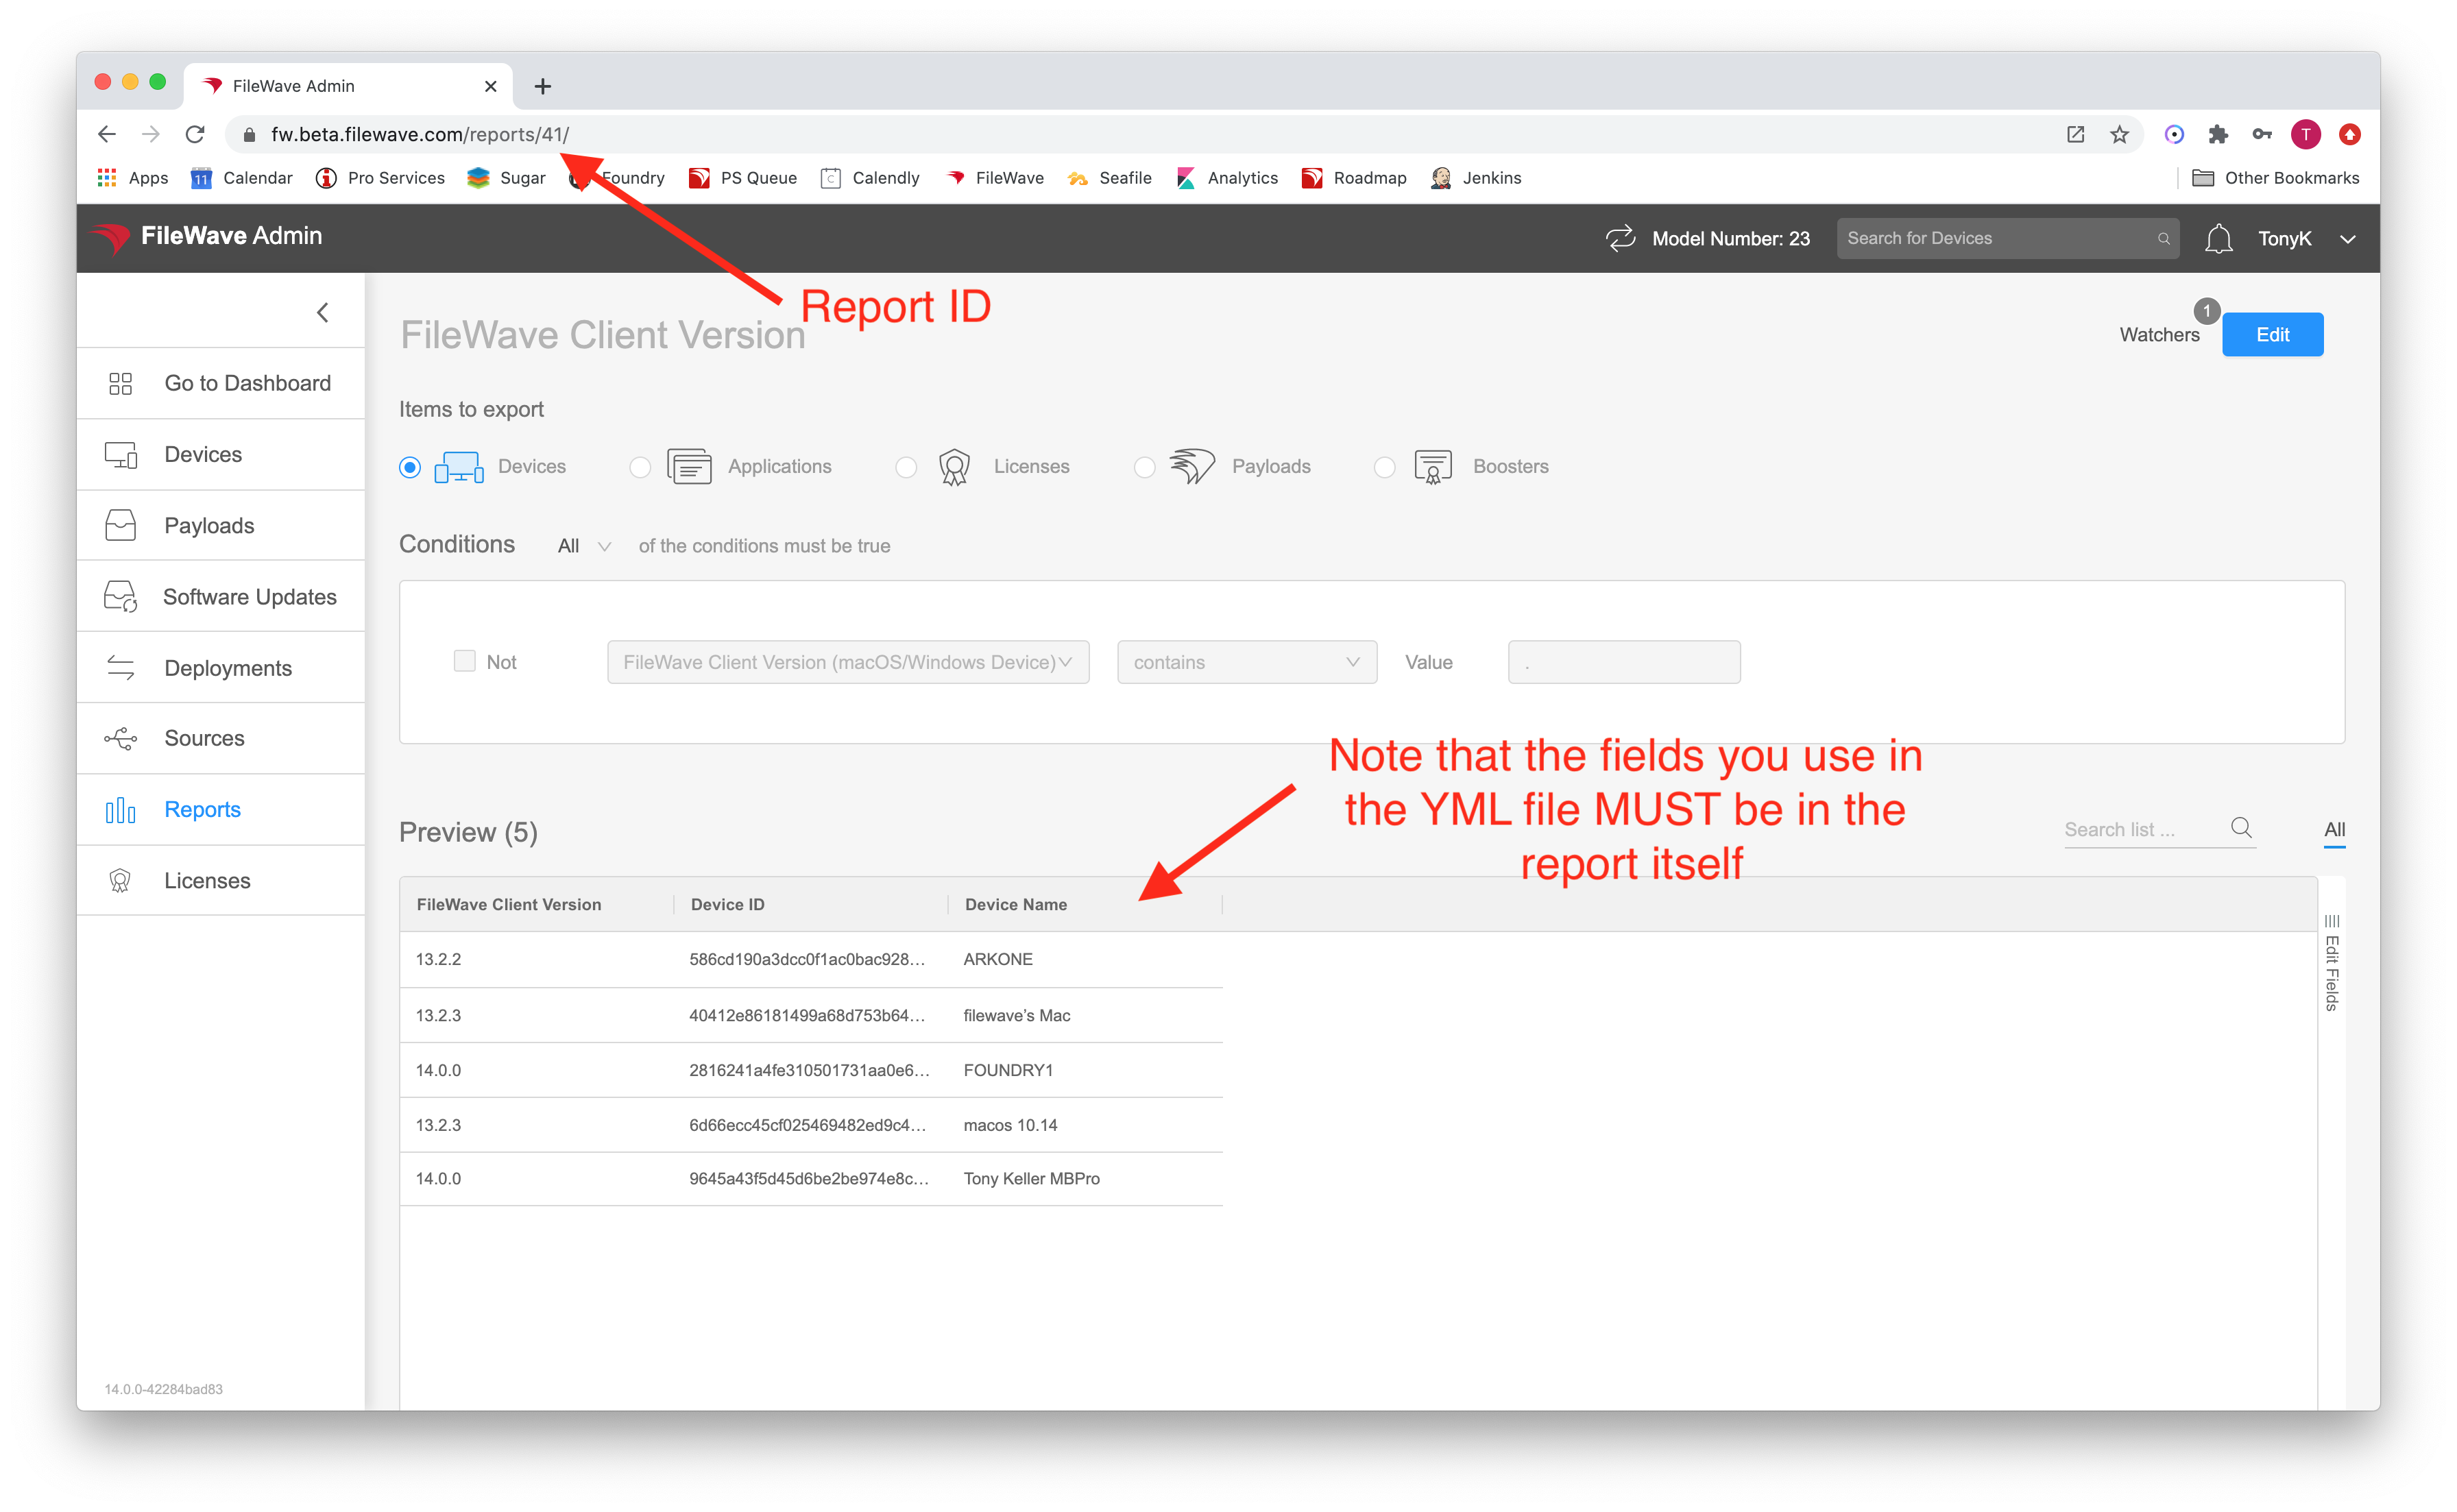 |
4. Get the definition for the fields you want to use from the API...the easiest way is to do a curl from the command line like this: bash<br>curl -s -k -H "Authorization: <Base64_API_Token>" https://<my.server.address>:20445/inv/api/v1/query/<report_id> | python -mjson.tool<br>Make sure and substitute in your values for the <Base64_API_Token>, <my.server.address> and <report_id> You'll get a response that includes the component and the field names as shown at right |
 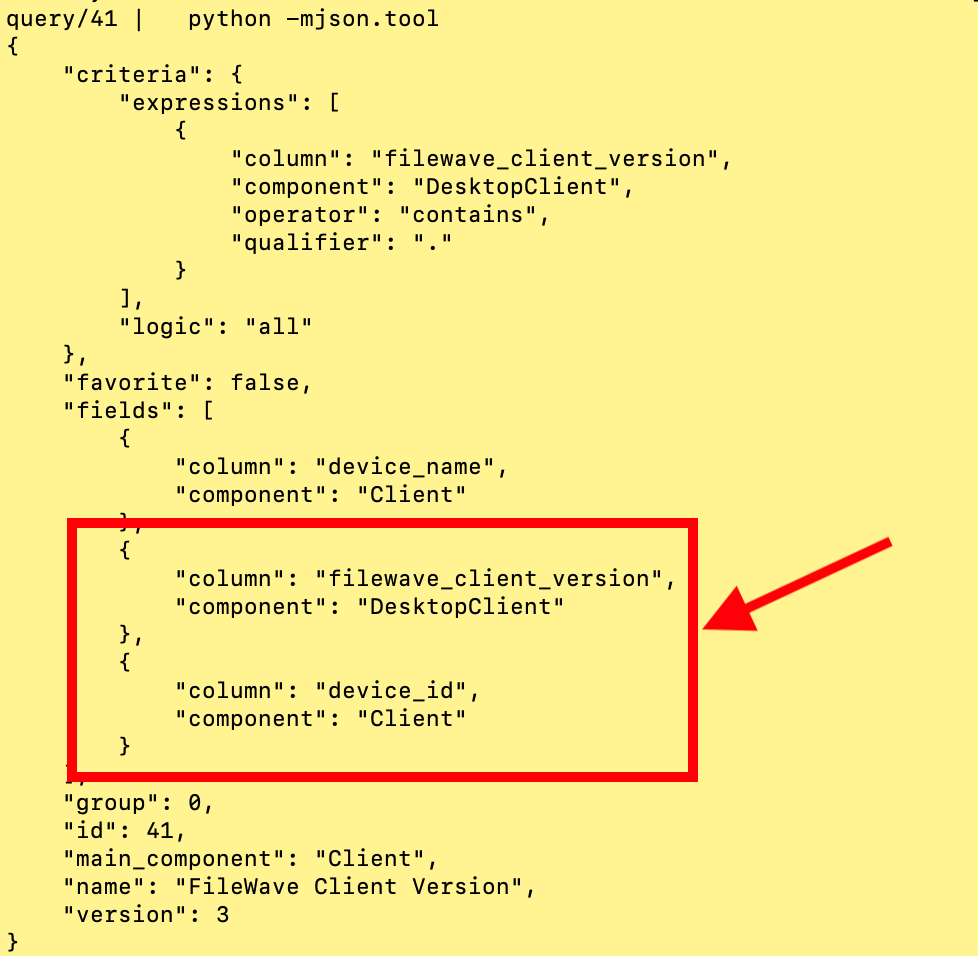 |
# only from the lines you intend to |
 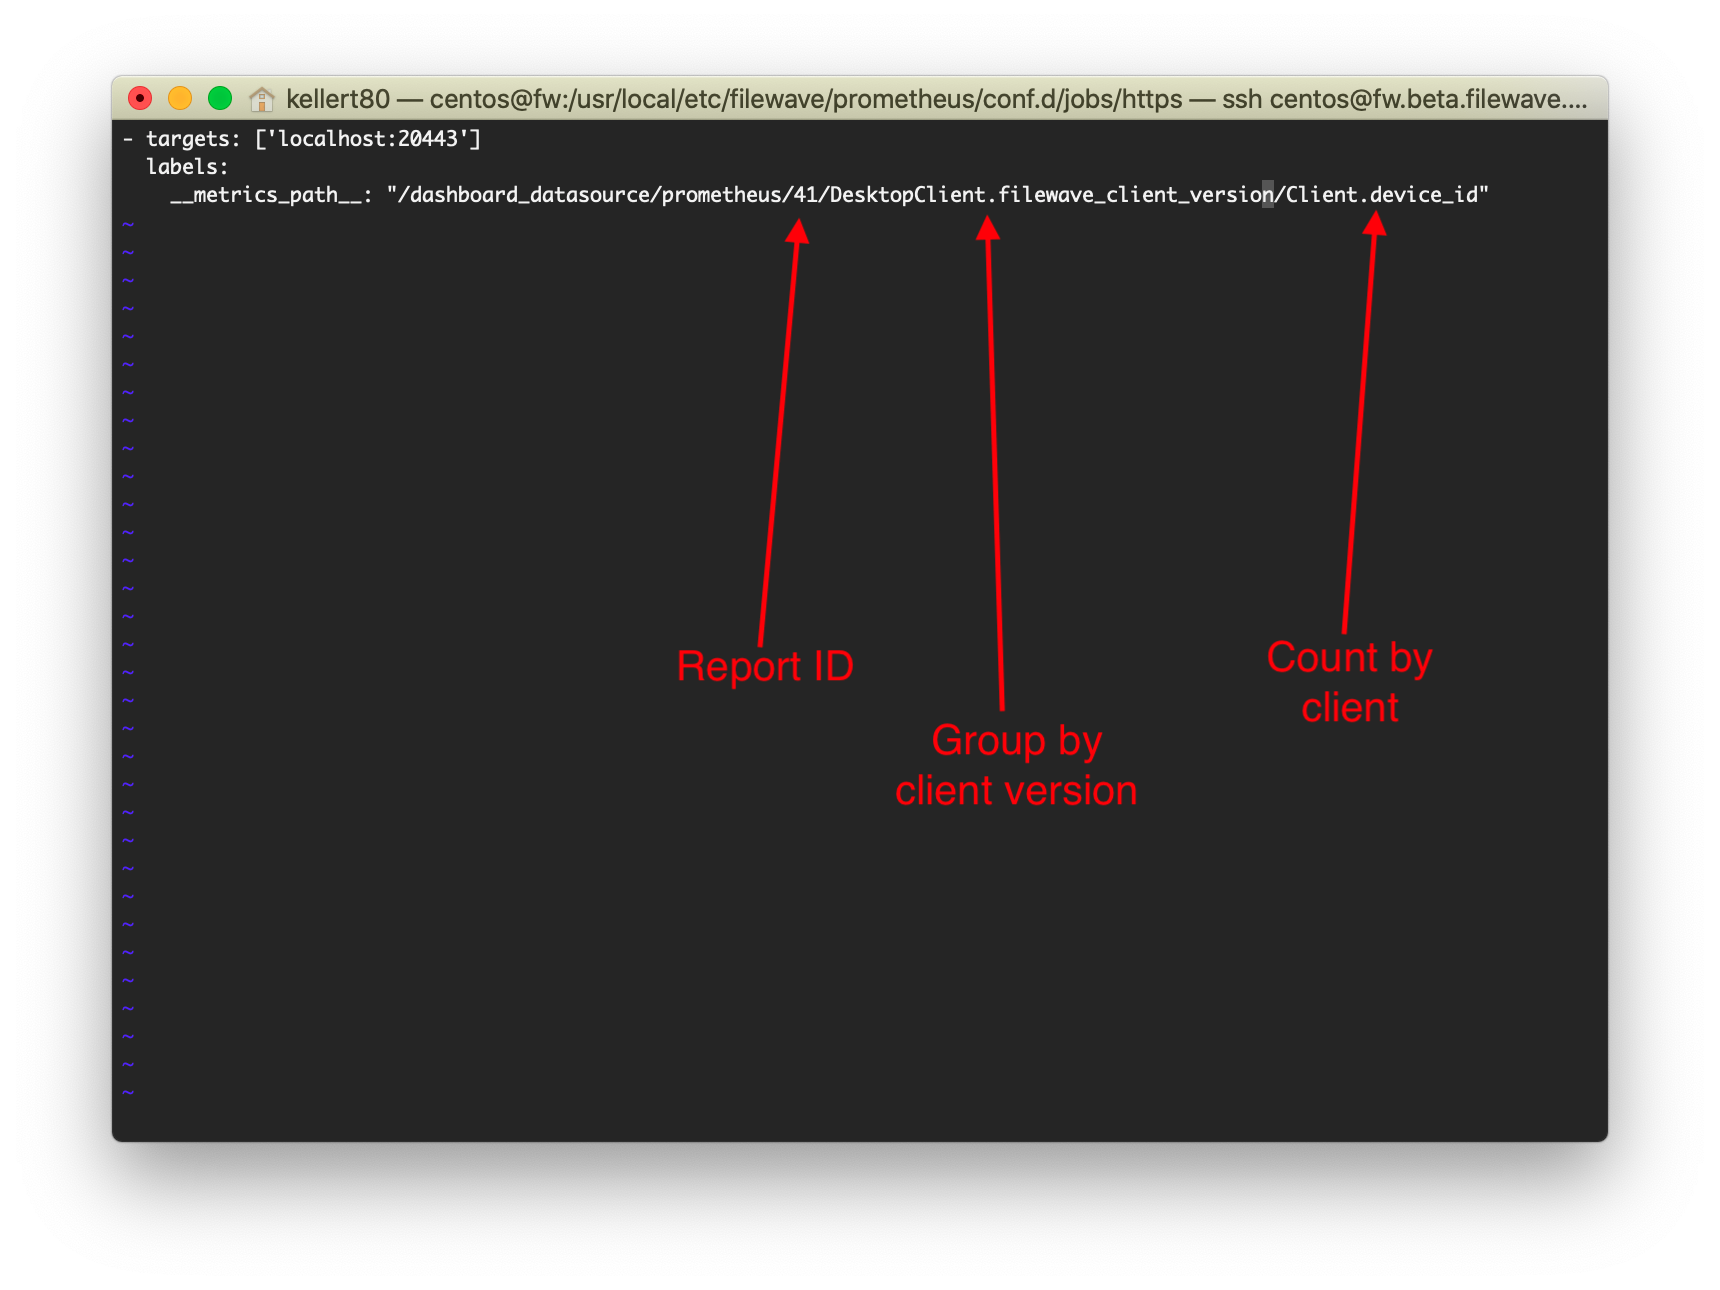 |
WithinAllow a minute or two offor creationPrometheus ofto read the file,job, then confirm that the datanew shouldmetric beis available inbefore yourbuilding dashboardthe for a newGrafana panel.