1.2 Default Dashboard
What
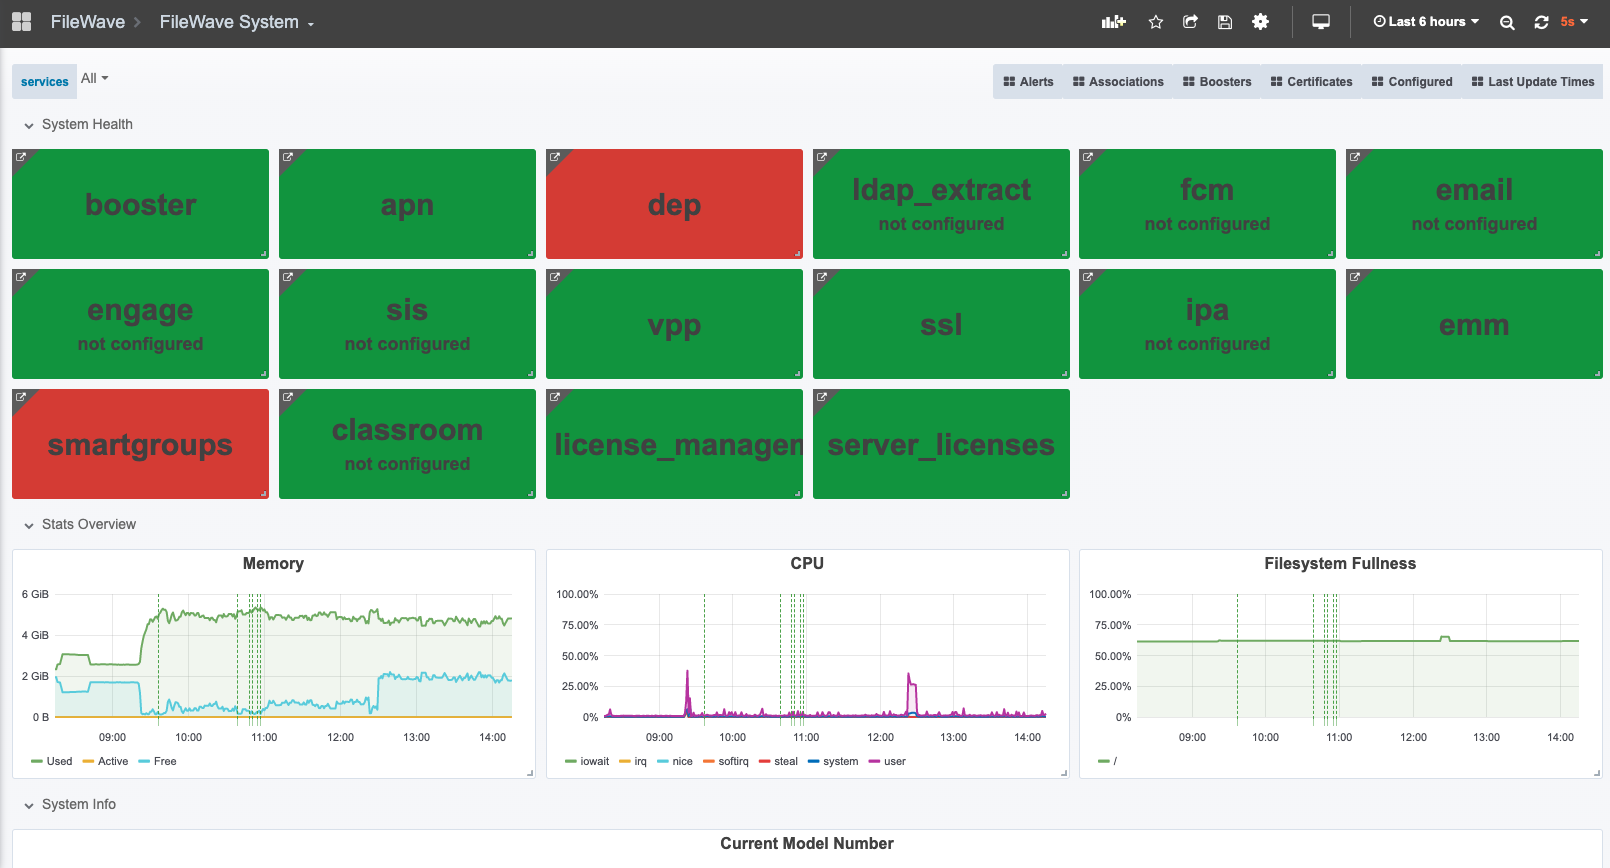
OnceWhen you accessopen the dashboard, youFileWave areshows going to be presented with athe default system dashboard that looks something like this:dashboard:

When/Why
ThisThe simpledefault dashboarddashboard, (calledFileWave System, gives you a quick health view of core FileWave System)services is basically the equivalent of the dashboard in the native admin. It shows you basicand configuration elements,items. andGreen let'swidgets youindicate knowhealthy whetheror thereconfigured areitems, configurationwhile issuesred withwidgets apoint simpleto coloritems code.that need attention.
How
TakingResolve actionthe underlying issue to remediate issues will resolveclear the reporting.dashboard i.e.warning. In the example above, Ithe dodep notwidget haveis ared because no macOS client is specified for use by DEP,DEP. thereforeAfter theyou DEP widget shows as red. If I uploadedupload the pre-configured client in my admin, this issue would be resolved, andclient, the widget wouldshould turn green.