1.2 Default Dashboard
What
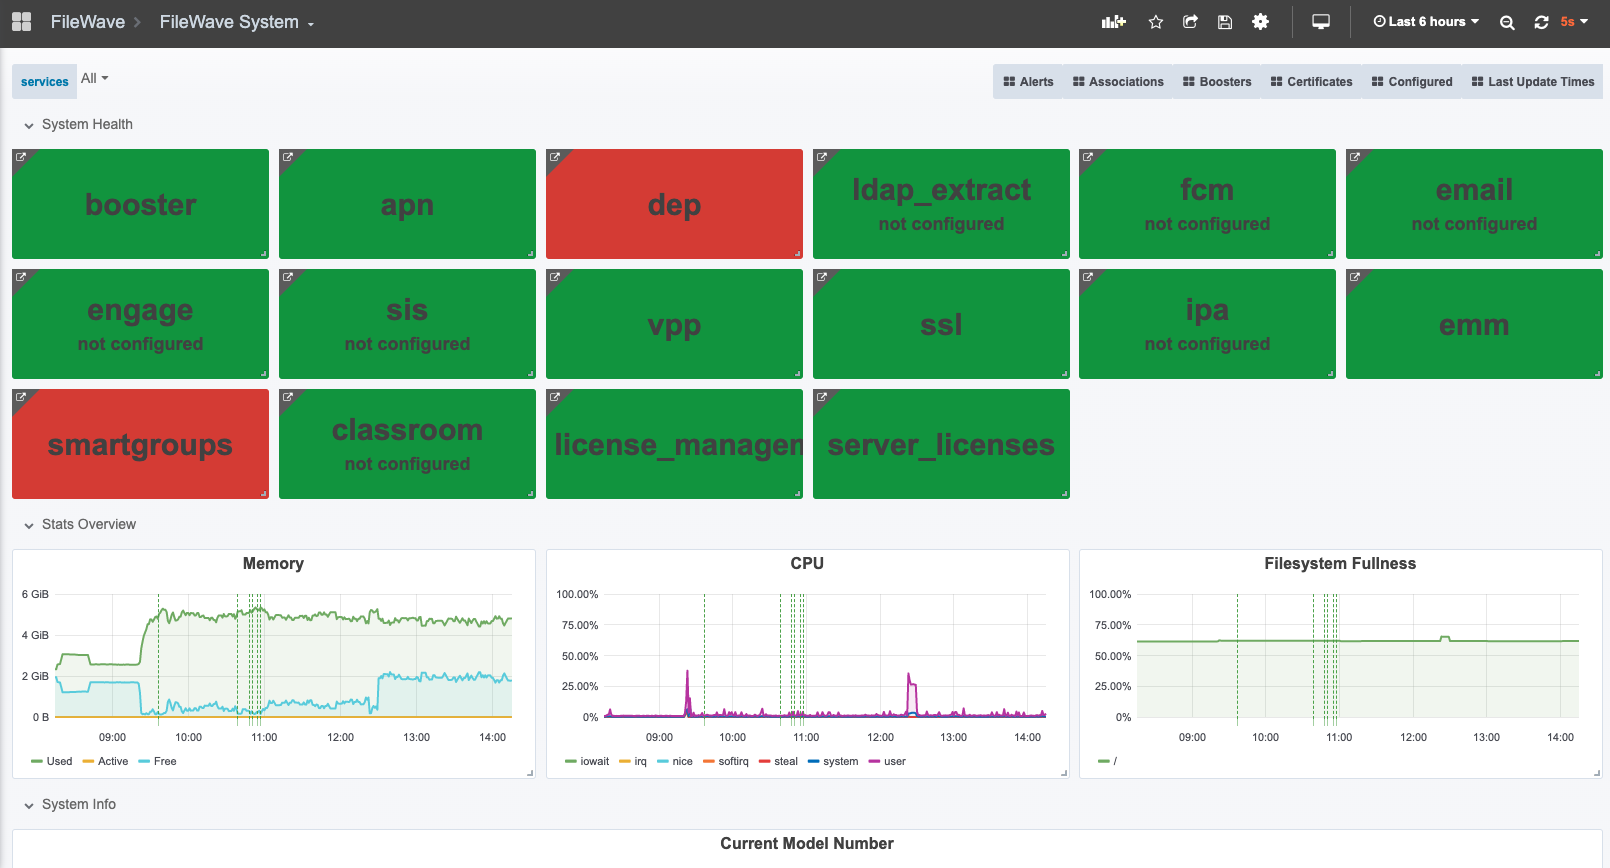
When you open the dashboard, FileWave shows the default system dashboard:
When/Why
The default dashboard, FileWave System, gives you a quick health view of core FileWave services and configuration items. Green widgets indicate healthy or configured items, while red widgets point to items that need attention.
How
Resolve the underlying issue to clear the dashboard warning. In the example above, the dep widget is red because no macOS client is specified for use by DEP. After you upload the pre-configured client, the widget should turn green.
No comments to display
No comments to display