3.1.2 Testing the Prometheus Scrape
What
Assume forIf a momentscrape youtarget madedoes anot typoappear in Grafana, first check whether Prometheus can see the yml file, or some other problem occursjob and yourwhether newthe scrape isn't showing in Grafana...how can you see what is going on?failing.
When/Why
ThankfullyPrometheus there isexposes a servicetargets runningpage that allows you to seeshows the status of allconfigured Prometheusscrapes. scrapes,That page is the quickest place to check for YAML mistakes, missing jobs, and willscrape usually give you an idea about what is going on. We can check a web page to get this detailed information.errors.
How
The webpage/portPrometheus intargets question thoughpage is NOTnot open by default to external systems andby we must access it in a special way. default. If the port were open, weyou would normally just gobrowse to https://my.server.address:21090/targets. Because But,it tois workclosed, aroundcreate thean portSSH nottunnel being opened, we can do the following (from terminal,your macOS):computer instead. From Terminal on macOS, run:
|
ssh -L 8000:localhost:21090 user@my.server.address |
Alternatively,On if you are on a Windows device,Windows, you can do the same thing throughin PuttyPuTTY by configuring a "tunnel"tunnel withfrom a local port of your choosing redirectingchoice to the FileWave server:Server:

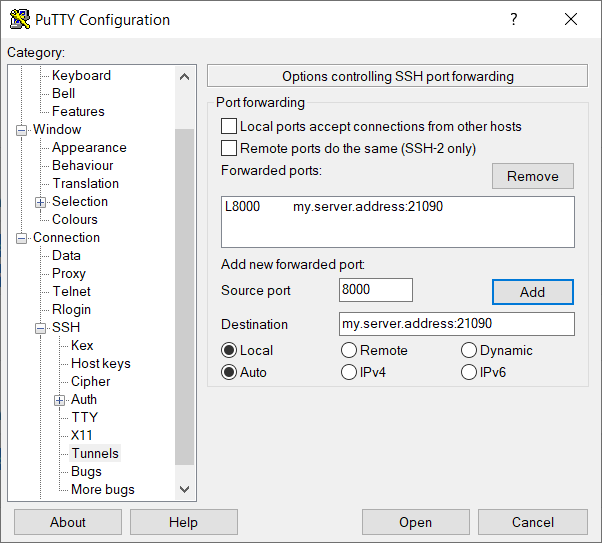
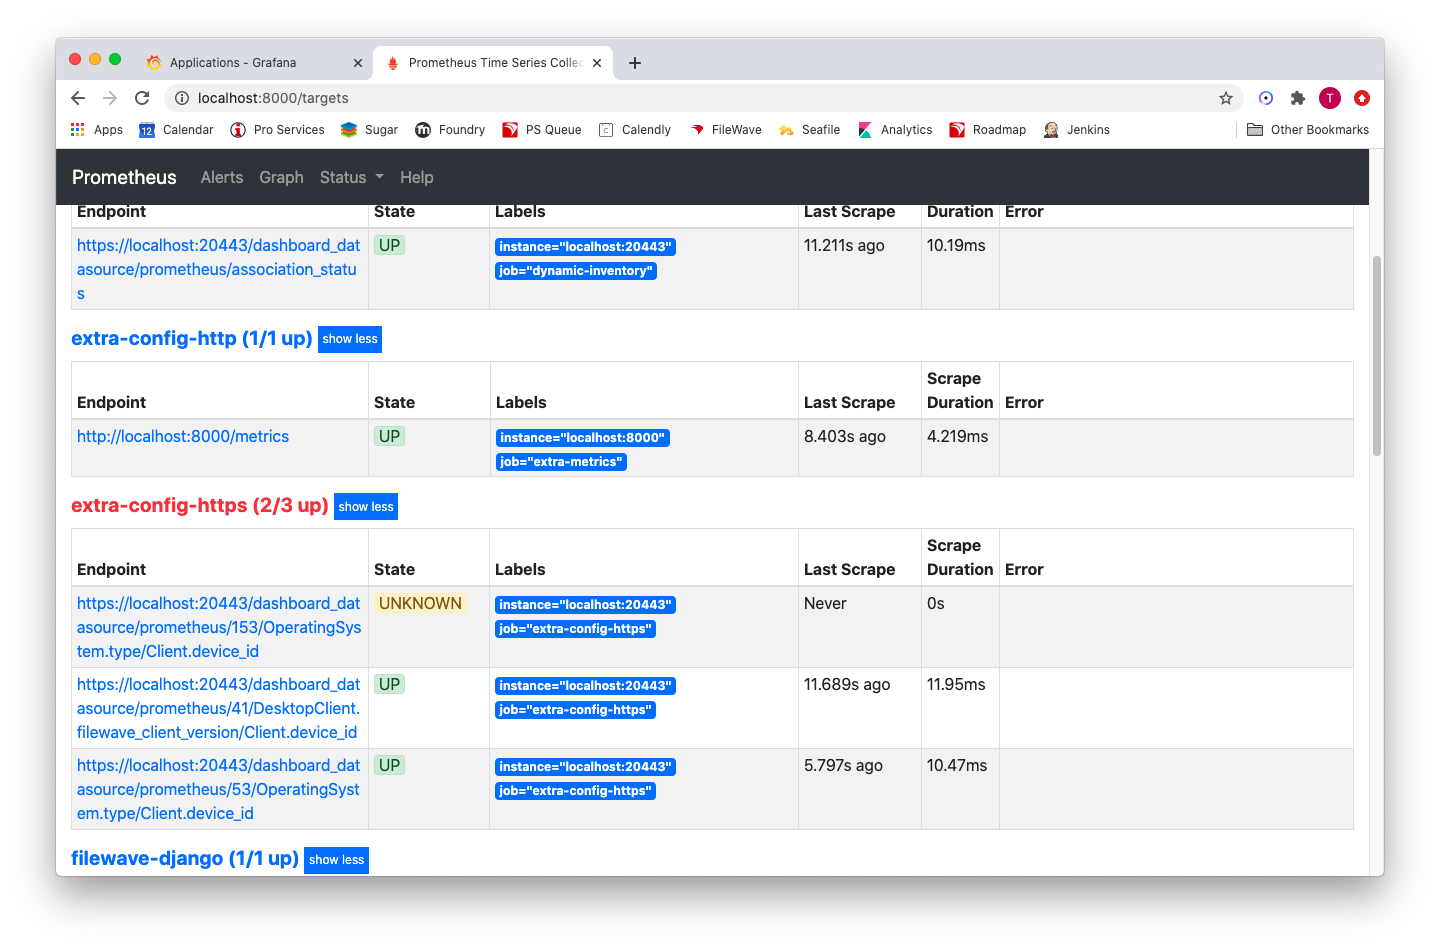
These configurations redirectssend our requestedlocal traffic backon port 8000 through the SSH connection to port 8000 on our local device, based21090 on the sshFileWave connectionServer. beingAfter established.the The resulttunnel is thatconnected, in our own browser then, we can go toopen http://localhost:8000/targets in your browser to seeview the scrape data.
SeeThe example below how I haveshows a mistakejob inwith onea ofbad myquery jobsreference. (queryQuery 153 doesn'tdoes actuallynot exist):exist, so Prometheus reports the scrape error on the targets page: