3.1.2 Testing the Prometheus Scrape
What
If a scrape target does not appear in Grafana, first check whether Prometheus can see the job and whether the scrape is failing.
When/Why
Prometheus exposes a targets page that shows the status of configured scrapes. That page is the quickest place to check for YAML mistakes, missing jobs, and scrape errors.
How
The Prometheus targets page is not open to external systems by default. If the port were open, you would browse to https://my.server.address:21090/targets. Because it is closed, create an SSH tunnel from your computer instead. From Terminal on macOS, run:
|
ssh -L 8000:localhost:21090 user@my.server.address |
On Windows, you can do the same thing in PuTTY by configuring a tunnel from a local port of your choice to the FileWave Server:
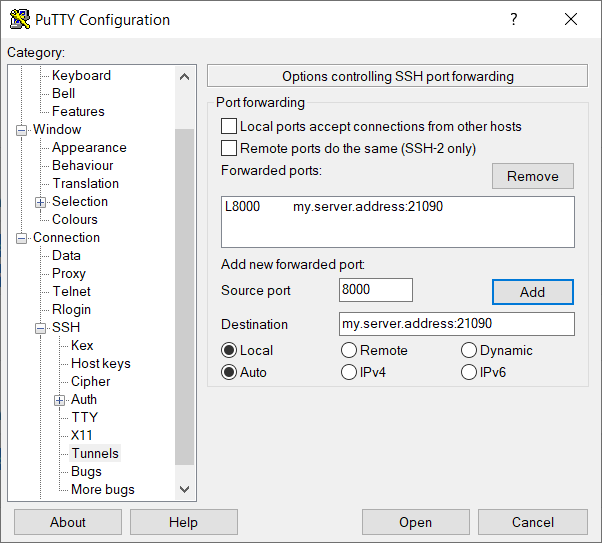
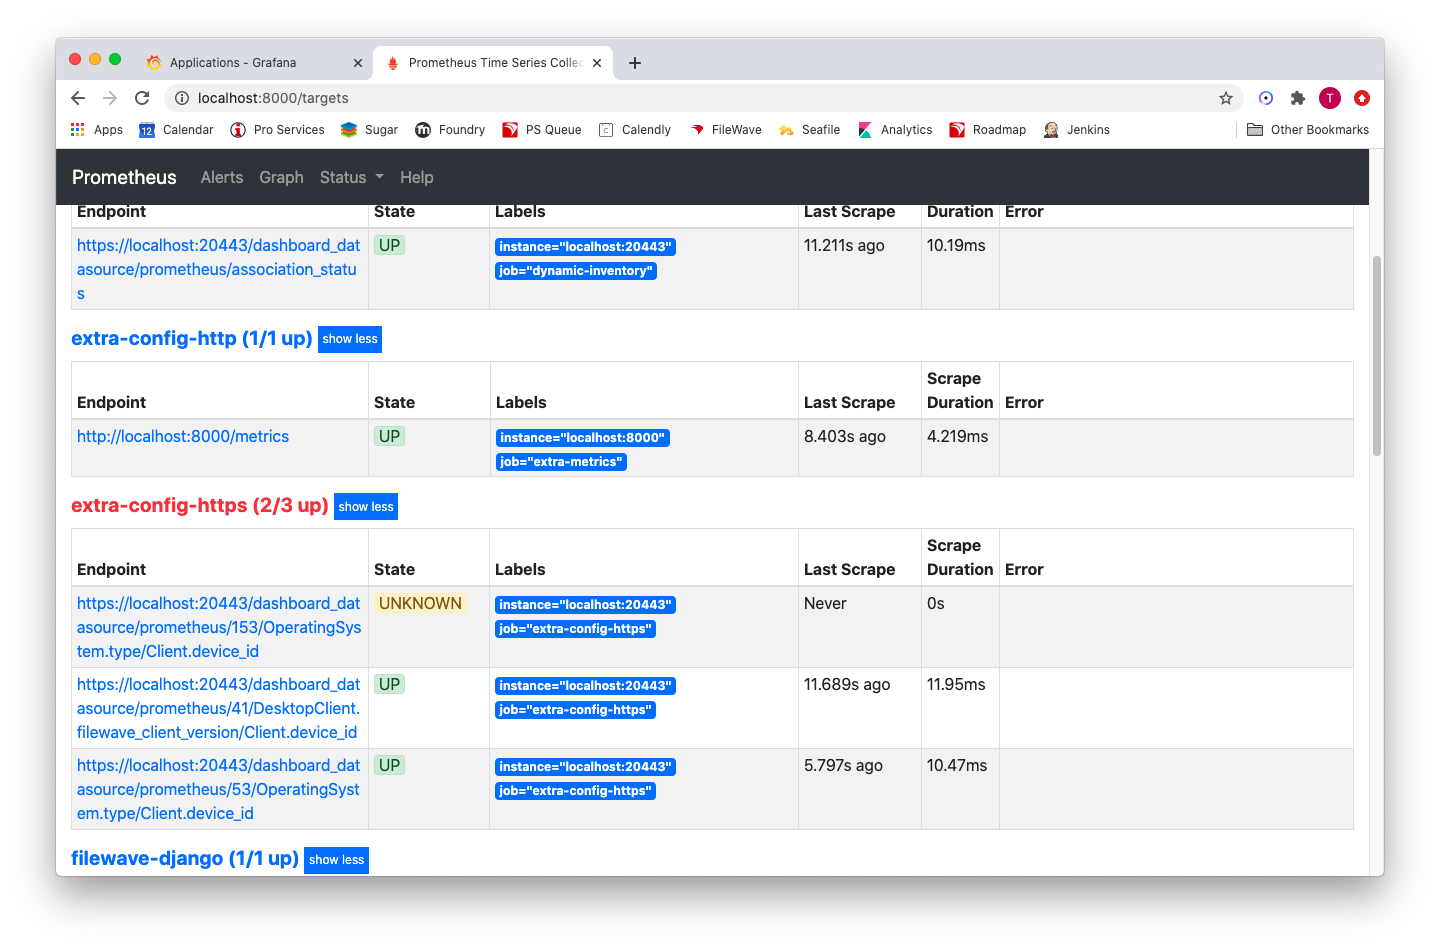
These configurations send local traffic on port 8000 through the SSH connection to port 21090 on the FileWave Server. After the tunnel is connected, open http://localhost:8000/targets in your browser to view the scrape data.
The example below shows a job with a bad query reference. Query 153 does not exist, so Prometheus reports the scrape error on the targets page:
No comments to display
No comments to display