
Using Grafana for Data Aggregation
What
Grafana hasdashboards been included withinin FileWave forcan quiteaggregate somereport time,data, butsuch onlyas withgrouping adevices recentby updateFileWave doesClient Grafanaversion haveor thecounting abilitydevices tomissing doeach data aggregation without using Prometheus. patch. This article shows you how to usebuild thisan feature.aggregated visualization from a FileWave report.
When/Why
We'llUse usedata Dataaggregation Aggregationwhen whenevera wedashboard wantshould toshow lookcounts ator angrouped overviewtotals instead of data.a raw list of devices. For instance,example, if we want to understand how many devices are missing OS patches, weyou might create a report showingof all devices, and theirdevices missing patches.OS patches, Togroup givethe a graphical representation of this, we would likely Group this dataresults by patch name, and Countcount the number of devices missing each.each This data is perfectpatch for a visualization like a bar or pie chart.
How
To create an aggregated visualization, we need to startStart with a FileWave report inthat FileWave.returns only the fields you want to chart. In this instance,example, we'll create athe report on the version ofshows the FileWave clientClient onversion Macfor macOS and Windows devices:
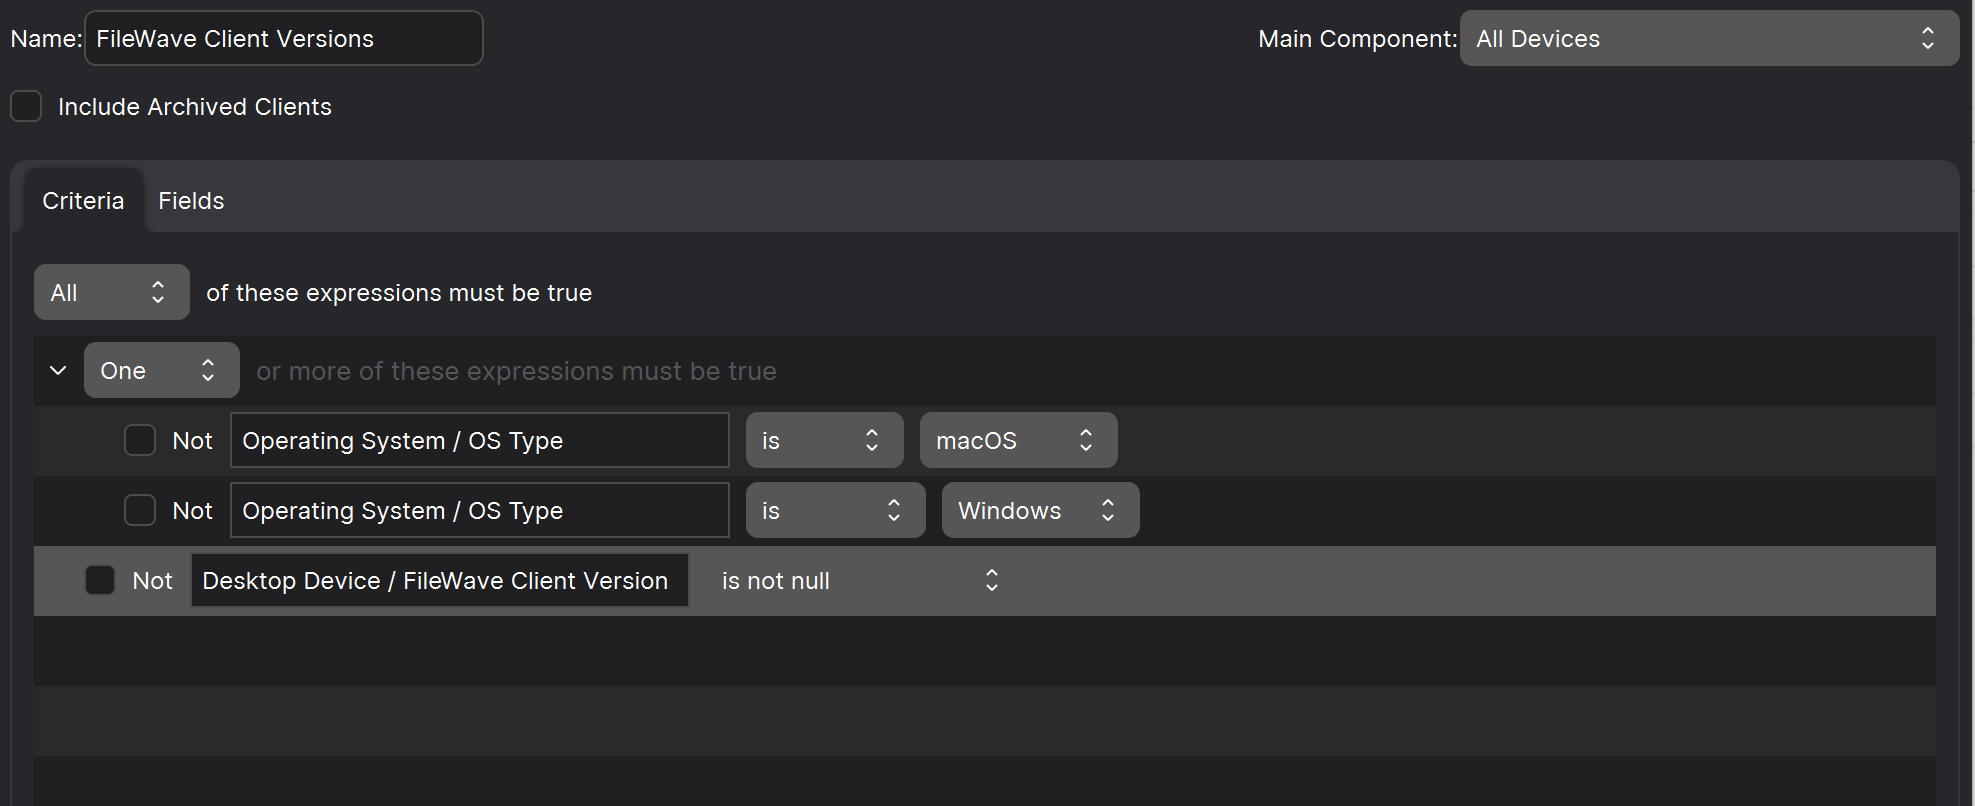
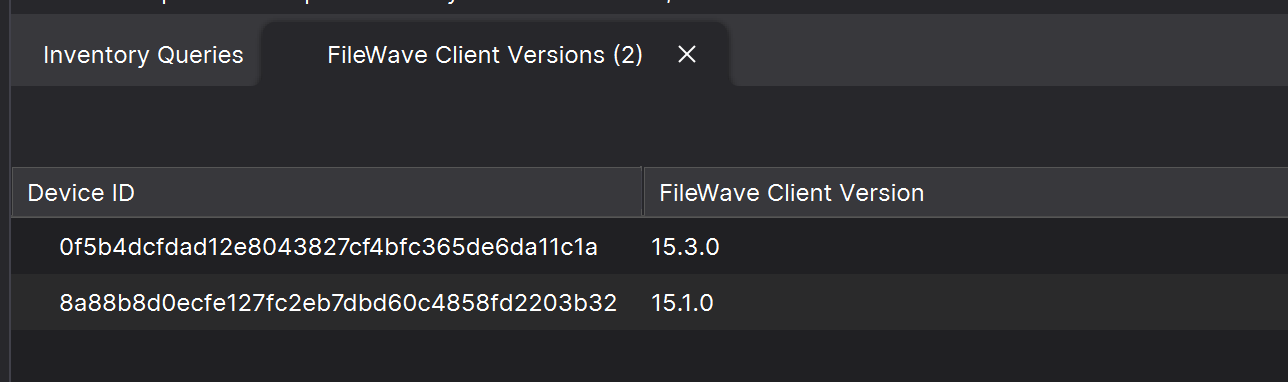
NoteThe thatreport wefilters includedout thatblank client-version values so the clientdashboard versions isdoes not null...thiscount preventsempty havingplaceholders. placeholders,It etc in the data. Also note that we only includedincludes two fields here:fields: FileWave Client VersionVersion, (which wewill intendbe to Group By),grouped, and Device IDID, (which wewill intendbe tocounted. count).This small Theretest aren'tsystem mayproduces devicesa inshort thisresult system, so the data just looks like this:set:
Now we are ready for the "dashboard" part of the exercise, so go into yourOpen Dashboard from FileWave AnywhereAnywhere, andthen follow alongthe withvideo thisto shortcreate video:the aggregated visualization:
Related Content
content