Using Grafana for Data Aggregation
What
Grafana dashboards in FileWave can aggregate report data, such as grouping devices by FileWave Client version or counting devices missing each patch. This article shows how to build an aggregated visualization from a FileWave report.
When/Why
Use data aggregation when a dashboard should show counts or grouped totals instead of a raw list of devices. For example, you might create a report of devices missing OS patches, group the results by patch name, and count the devices missing each patch for a bar or pie chart.
How
Start with a FileWave report that returns only the fields you want to chart. In this example, the report shows the FileWave Client version for macOS and Windows devices:
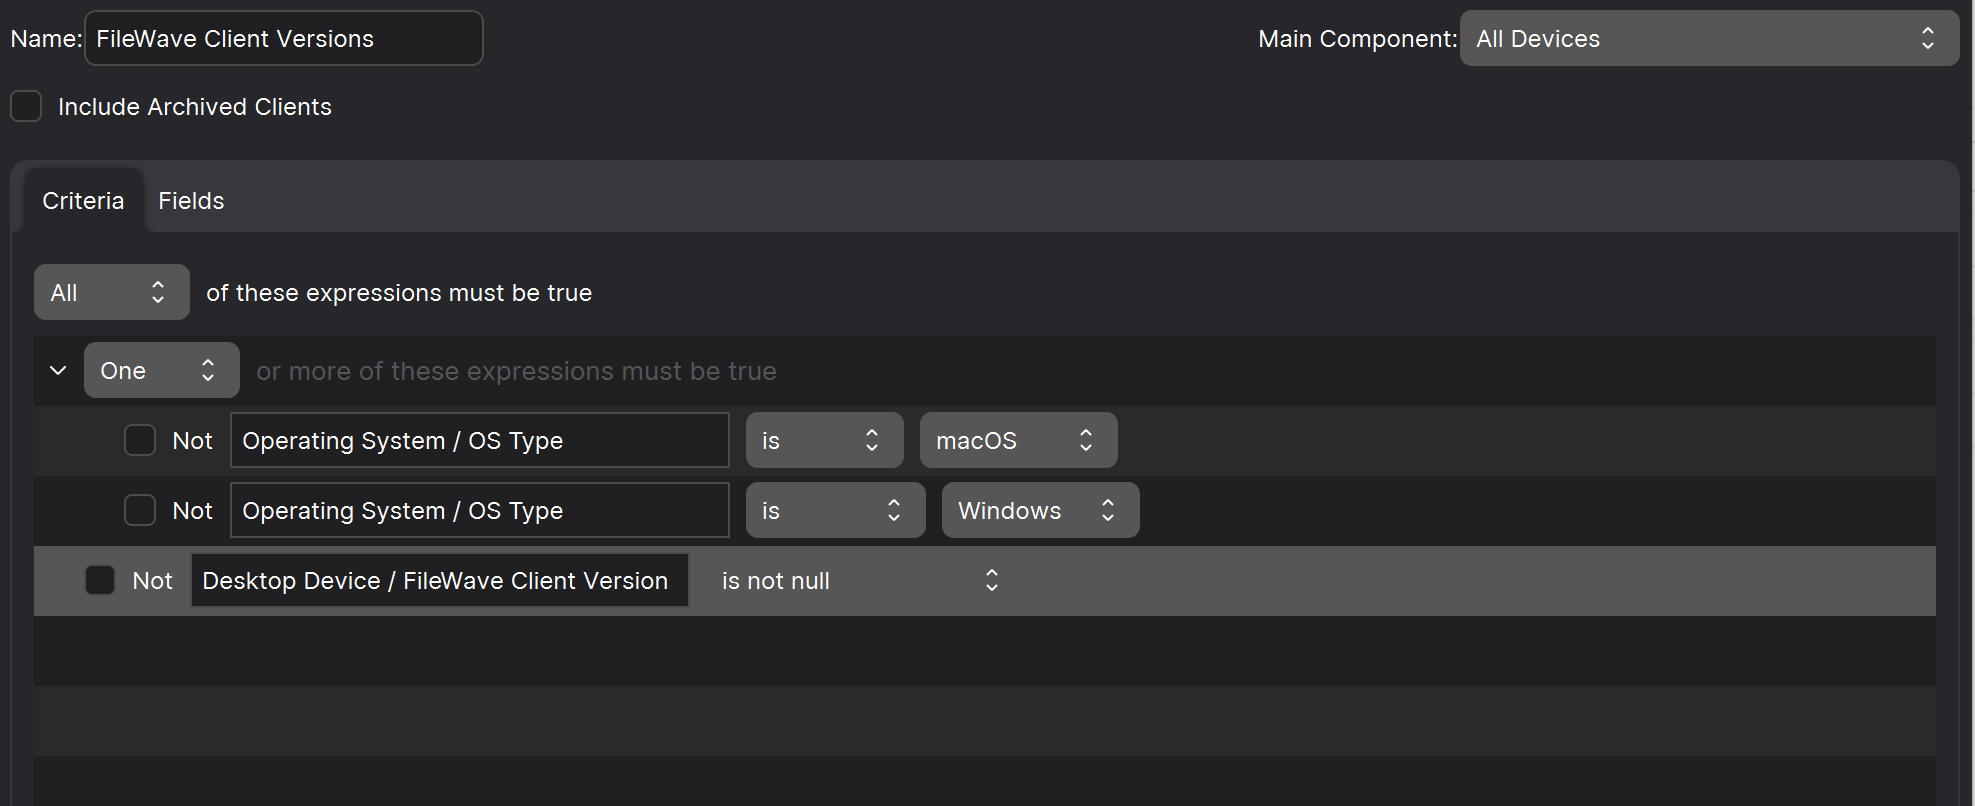
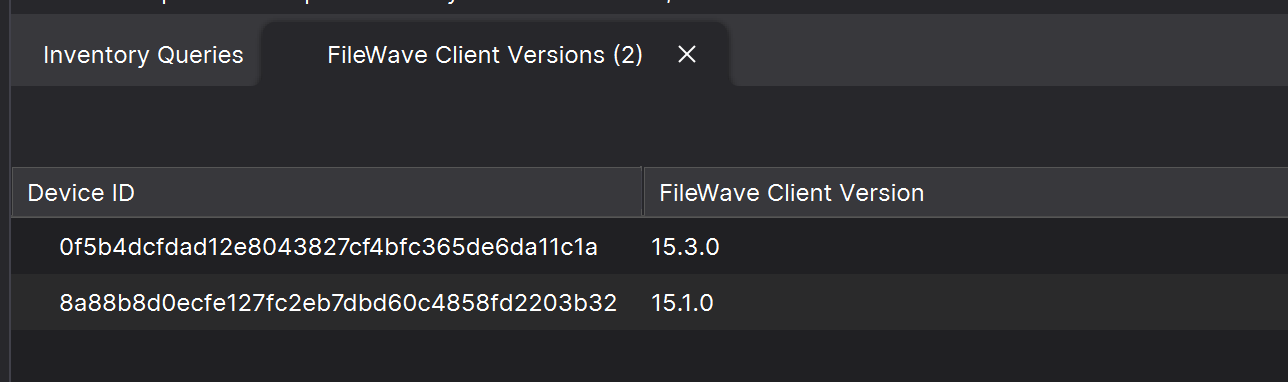
The report filters out blank client-version values so the dashboard does not count empty placeholders. It includes two fields: FileWave Client Version, which will be grouped, and Device ID, which will be counted. This small test system produces a short result set:
Open Dashboard from FileWave Anywhere, then follow the video to create the aggregated visualization:
No comments to display
No comments to display