
Custom Grafana Dashboard - YML Files not being processed
What
YouA may notice that yourcustom Grafana dashboard won’tmay processstop processing data from YML files.files This can happen ifafter the FileWave API key is regeneratedregenerated. forWhen FileWave,that buthappens, Grafana keeps using the fileold thatbearer_token_file, Grafana uses is not updated. As recently as FileWave 14.9.0, this can be an issue with an easy solution outlined below. Development is looking at possibly always overwriting this file at server startup which would eliminate this problem from appearing, and it should only appear as an issue ifso the APIYML-backed keytargets forcannot the server is regenerated, causing it to not match. For most customers, this is not likely to be an issue.authenticate.
When/Why
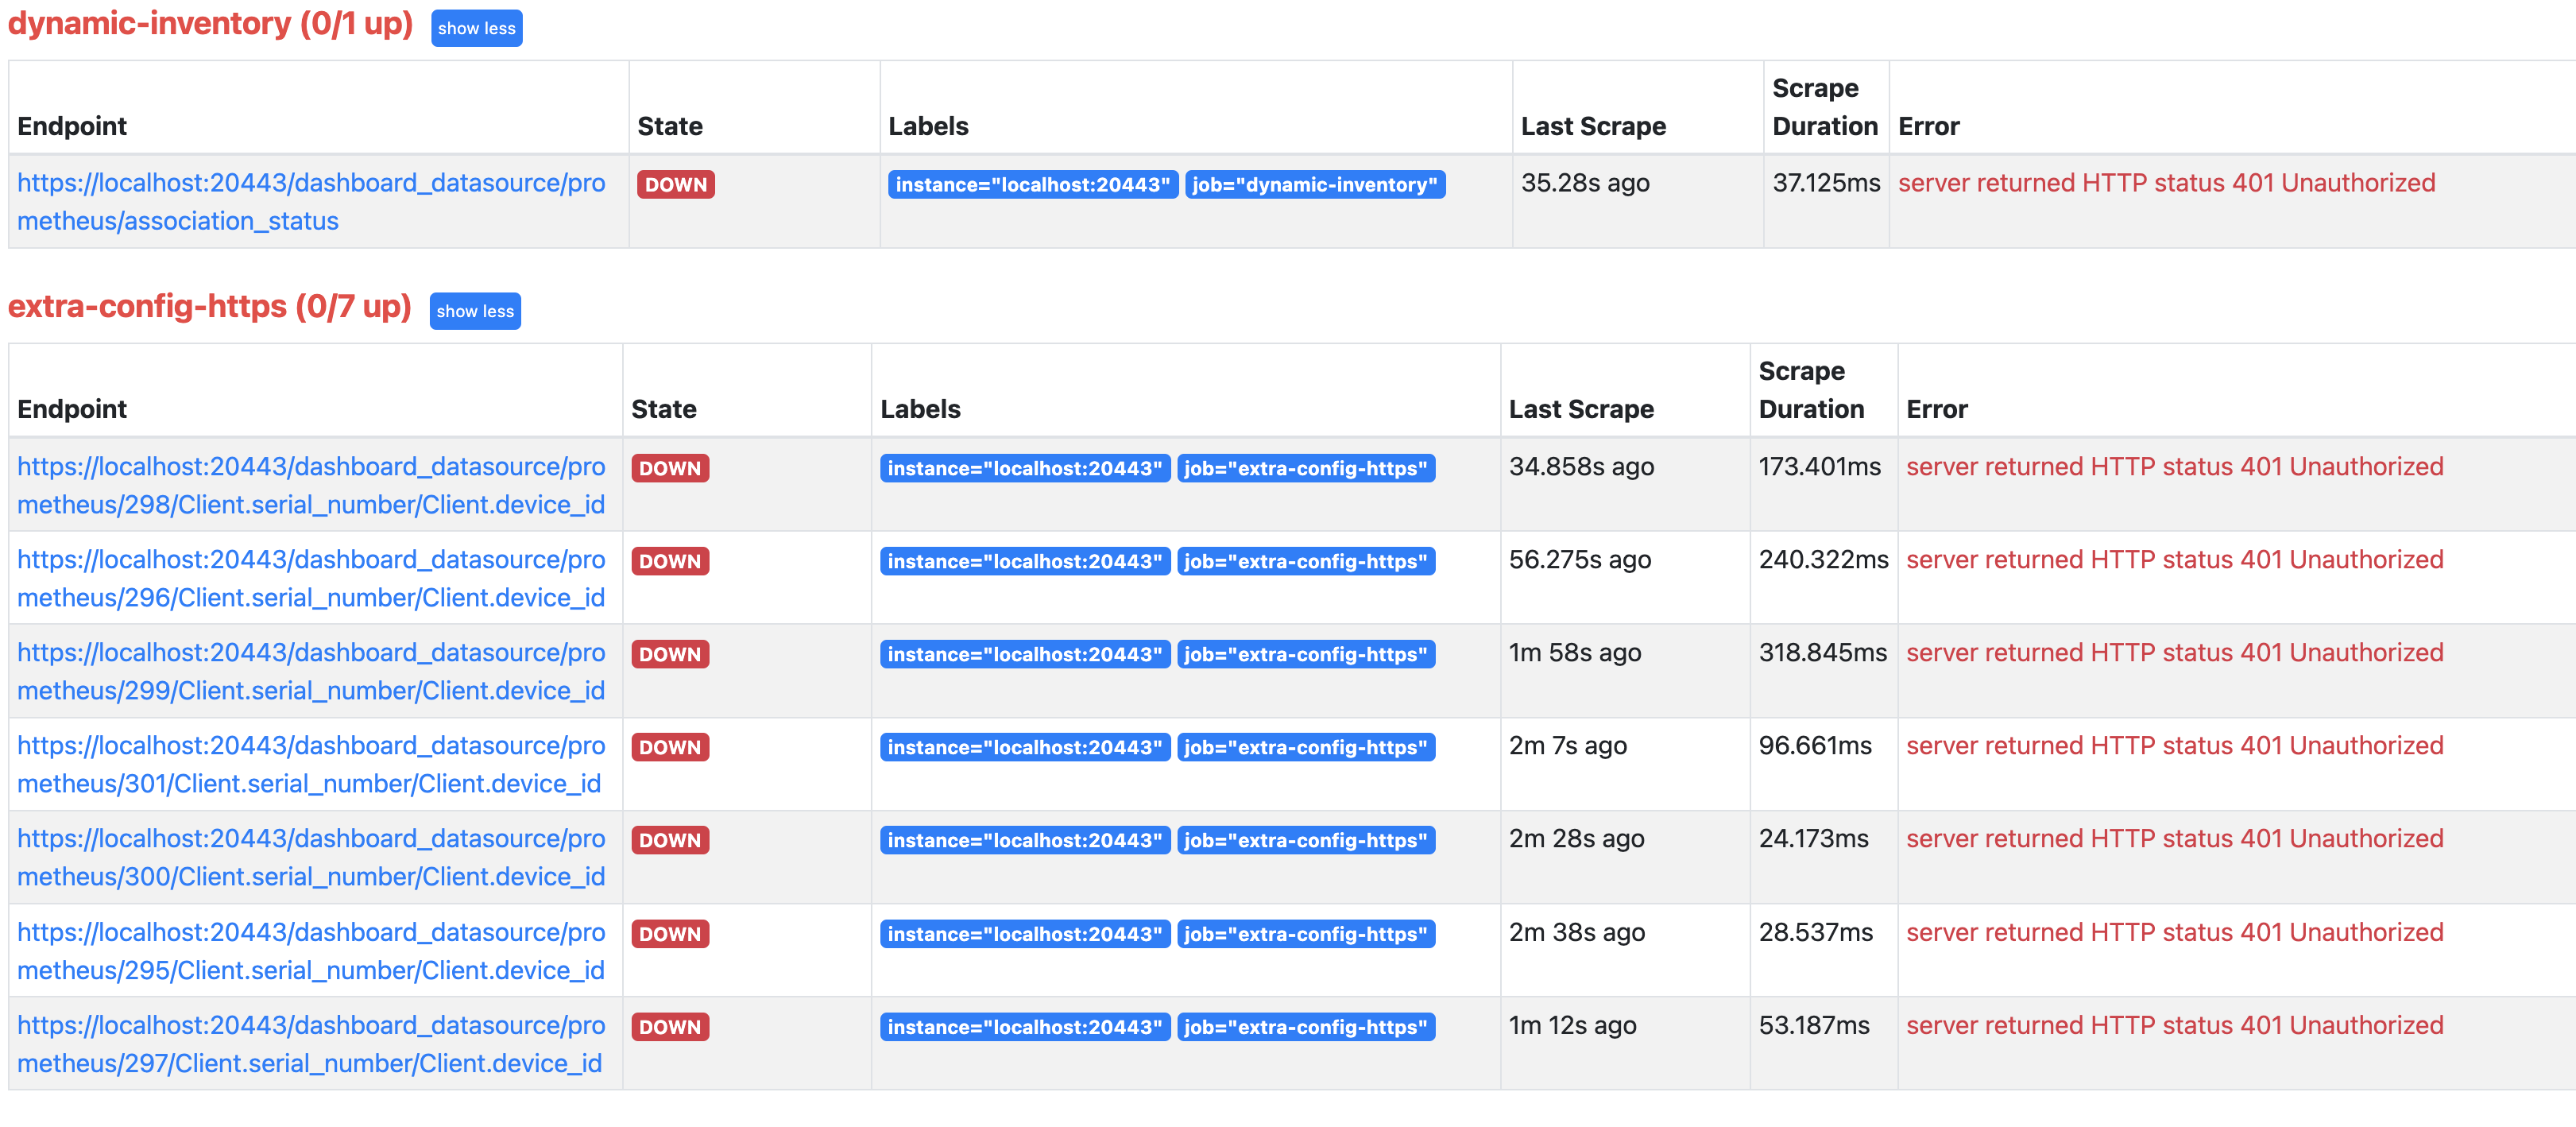
When you use 3.1.2 Testing the Prometheus Scrape aswhile you setsetting up a custom Dashboard with a YML file, youthe targets may see that the files show “DOWN,” as seenshown below. ThisDashboard is a signwidgets that you are experiencing this issue. You’ll also see no datadepend on yourthose widgetstargets inwill thenot Dashboard.populate.

How
To fix this issue,this, SSH to yourthe serverFileWave Server and remove thebearer_token_file. file,Restart asFileWave shownServer below.so it regenerates the bearer_token_filefile haswith the wrongcurrent API key,key. Hosted customers should contact FileWave Support; support often handles custom YML uploads and if you restart FileWave after deleting it, then a new correct one will be regenerated. If you are a hosted customer, then you will need support tocan remove thisthe file for you, and very likely, they helped you upload the YML file, to begin with.you.
rm /usr/local/etc/filewave/prometheus/conf.d/bearer_token_file
/usr/local/bin/fwcontrol server restart