Custom Grafana Dashboard - YML Files not being processed
What
A custom Grafana dashboard may stop processing data from YML files after the FileWave API key is regenerated. When that happens, Grafana keeps using the old bearer_token_file, so the YML-backed targets cannot authenticate.
When/Why
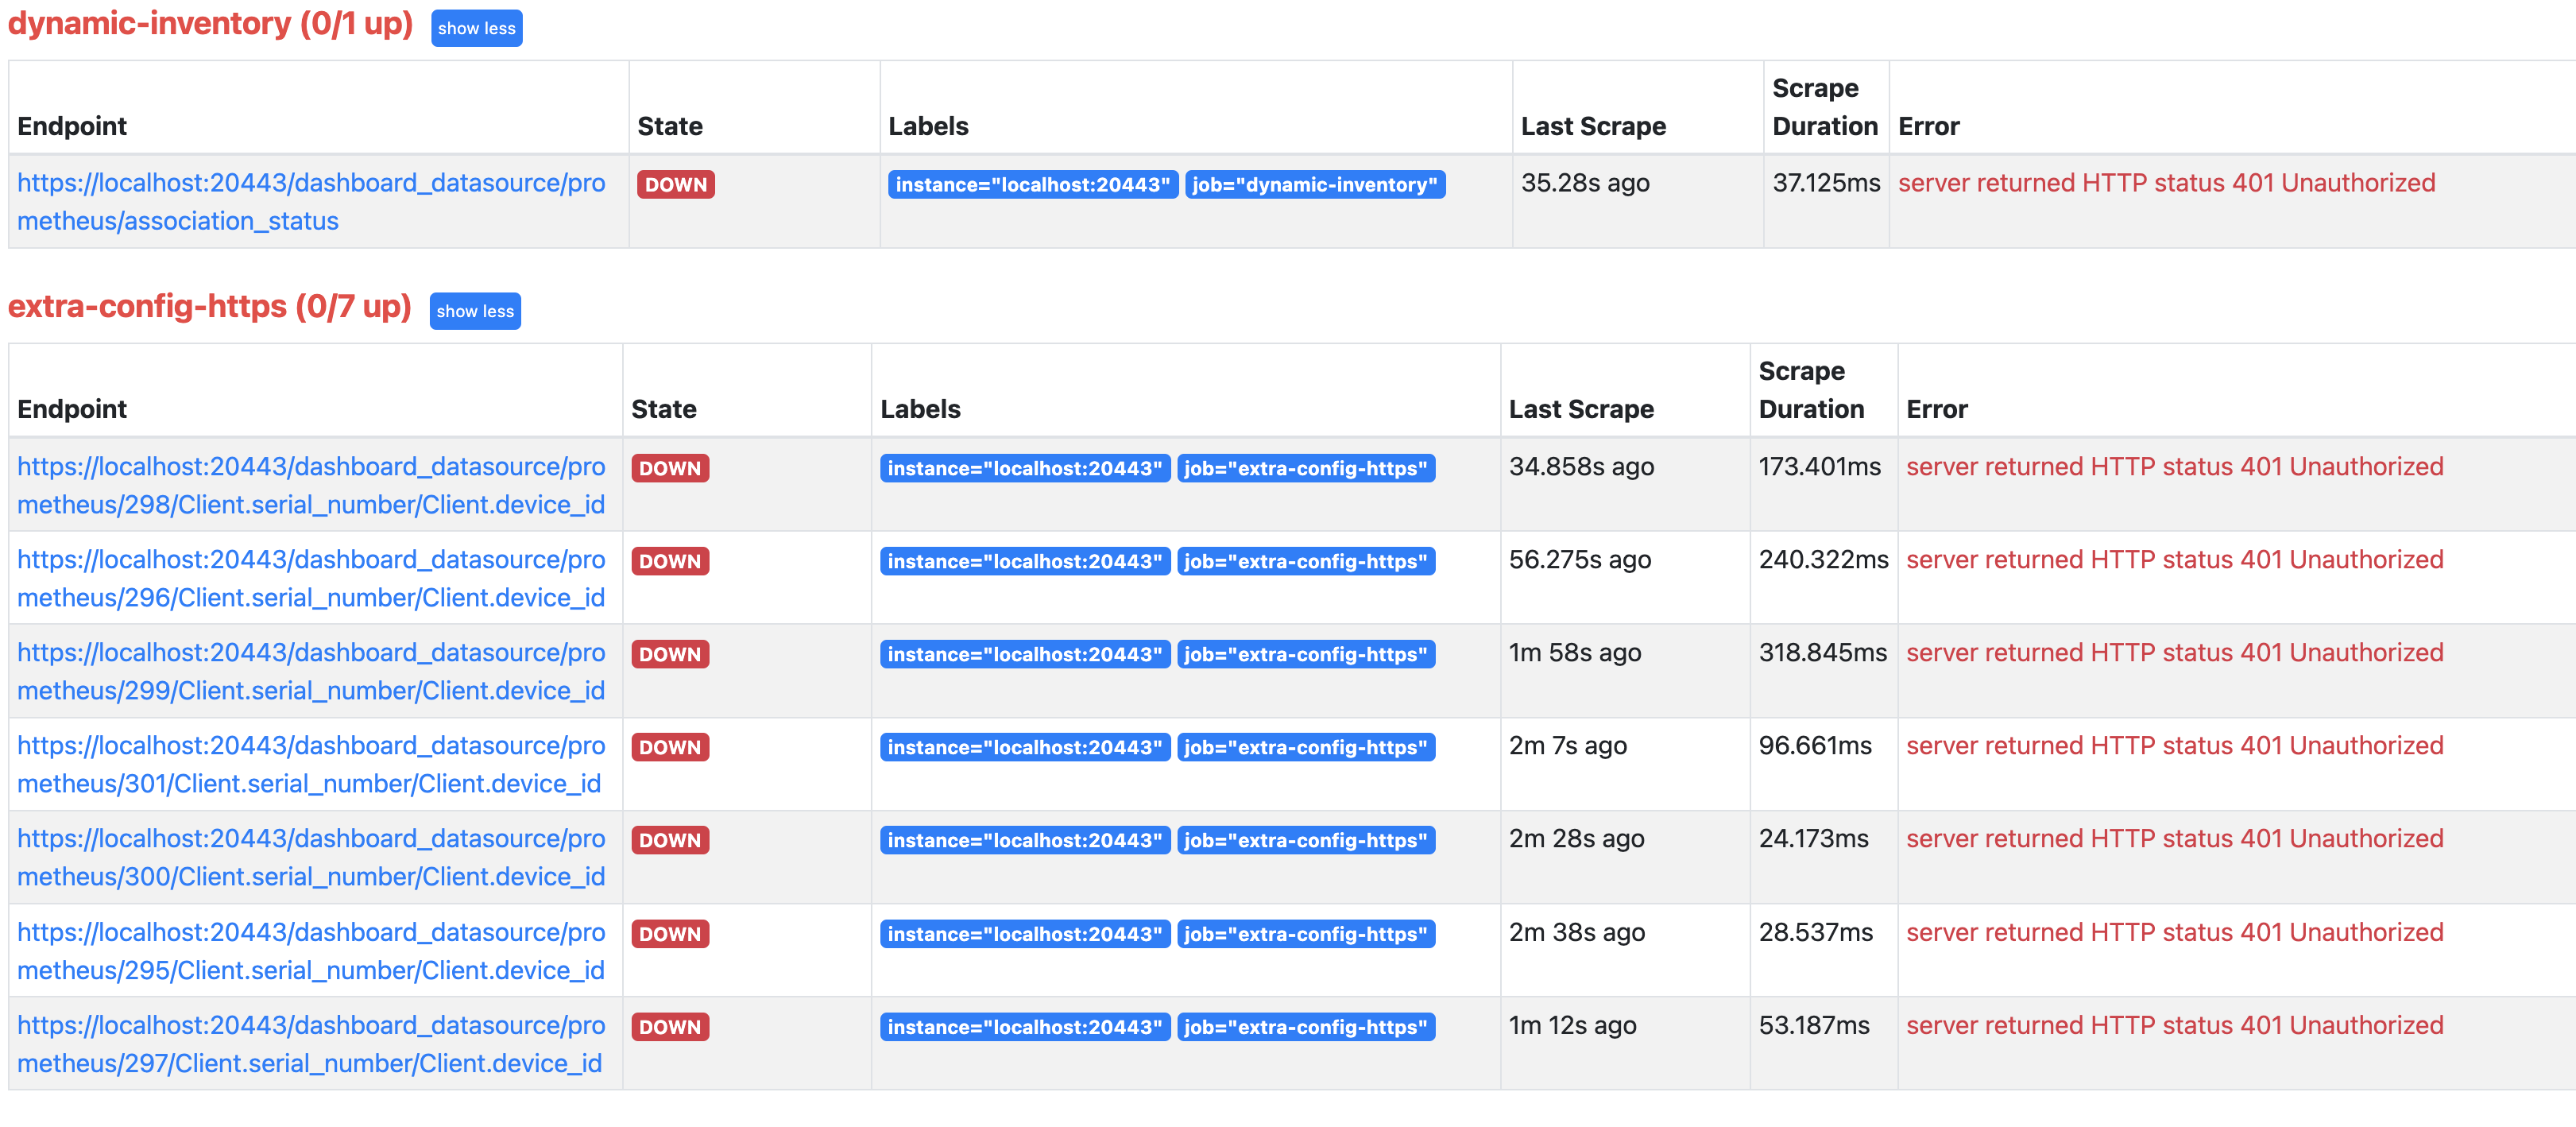
When you use 3.1.2 Testing the Prometheus Scrape while setting up a custom Dashboard with a YML file, the targets may show “DOWN,” as shown below. Dashboard widgets that depend on those targets will not populate.
How
To fix this, SSH to the FileWave Server and remove bearer_token_file. Restart FileWave Server so it regenerates the file with the current API key. Hosted customers should contact FileWave Support; support often handles custom YML uploads and can remove the file for you.
rm /usr/local/etc/filewave/prometheus/conf.d/bearer_token_file
/usr/local/bin/fwcontrol server restart
No comments to display
No comments to display