2.3 Widget/Panel Elements
What
All panels (or widgets) on the FileWave dashboard are comprised of the same basic elements. This article reviews those elements at a high level.
When/Why
If you are using pre-existing panels, you won't care too much about how they are built. However, as soon as you want to build your own panels, the building blocks become quite important.
How
All panels have the following three elements:
- The Query (Choosing what data you want to see in the panel)
- The Visualization (Choosing the visual representation of the data: gauge, bar chart, table...)
- General (Panel properties such as title, comment, links)
In the below you'll see examples of each of these elements:
|
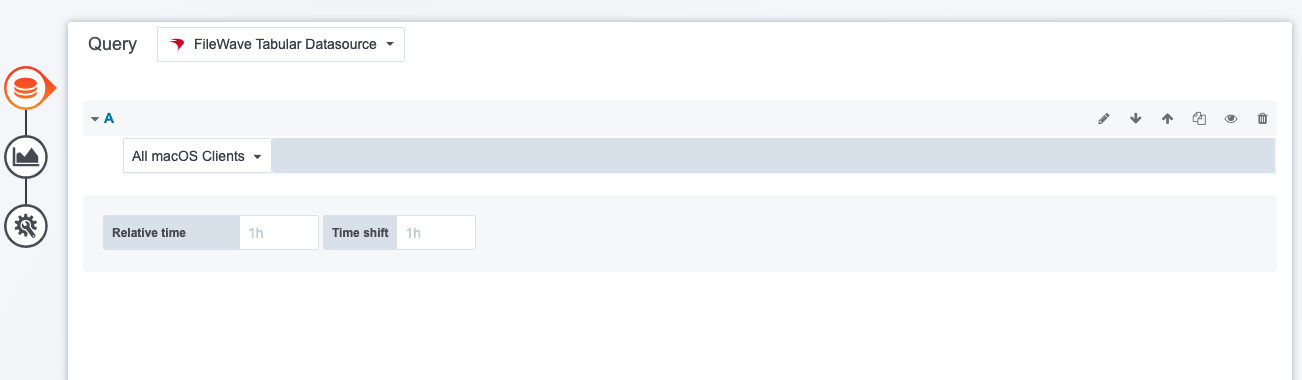
The Query |
|
|
|
The query you choose defines the data provided to the panel. In this case, an inventory query was selected. |
|
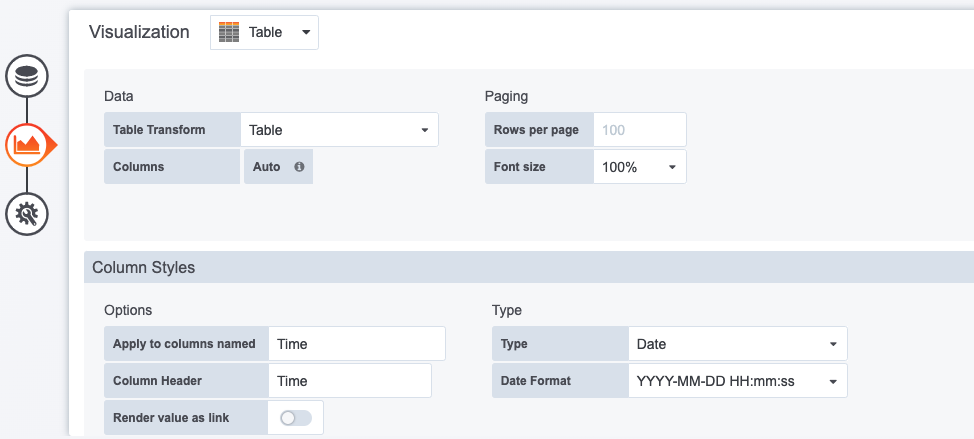
The Visualization |
|
|
|
Because we chose an inventory query as our data source, a table was our only possible visualization. In our more advanced example though, you'll see that we can do charts and graphs here of all sorts. |
|
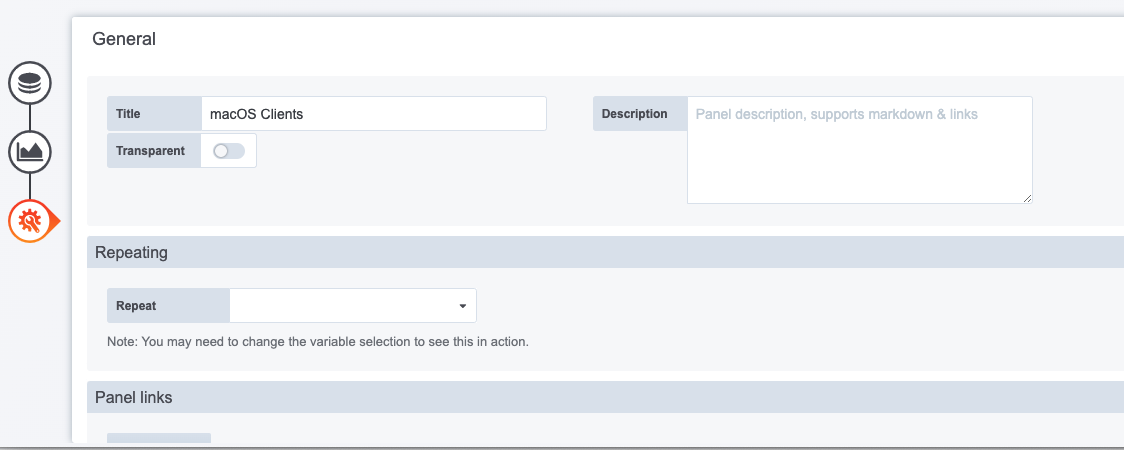
General |
|
|
|
We only specified a name in this case for this panel, but it is very useful to also set a link for the panel to tie directly into a report in the webadmin. |
No comments to display
No comments to display