
3.1.2 Testing the Prometheus Scrape
What
If a scrape target does not appear in Grafana, first check whether Prometheus can see the job and whether the scrape is failing.
When/Why
Prometheus exposes a targets page showing configured scrape targets, their state, last scrape and any reported error. Use it to distinguish a missing target from a target whose scrape is failing; it is not a YAML syntax validator.
How
Access required: The SSH steps below are for an authorized administrator of a self-managed FileWave Server. Hosted customers should ask FileWave Technical Support to check the target and server-side configuration. Keep the intended Inventory Report ID and custom job configuration available for comparison.
The Prometheus targets page is not open to external systems by default. If the port were open, you would browse to https://my.server.address:21090/targets. Because it is closed, create an SSH tunnel from your computer instead. From Terminal on macOS, run:
|
ssh -L 8000:localhost:21090 user@my.server.address |
On Windows, configure an SSH session to the FileWave Server in PuTTY. Under Connection > SSH > Tunnels, use source port 8000, destination localhost:21090, and Local, then add the forwarding rule and open the SSH session. Leave Local ports accept connections from other hosts unchecked. The older screenshot below uses the Server address as its destination; use localhost:21090 to match the Terminal example and reach the service from the Server itself.
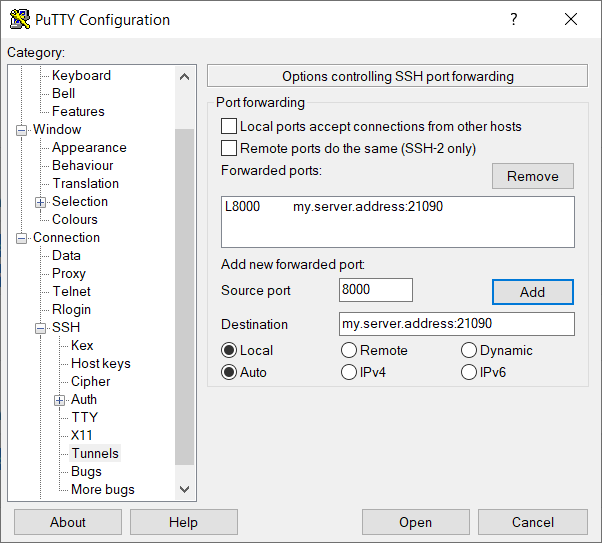
These configurations send local traffic on port 8000 through the SSH connection to port 21090 on the FileWave Server. After the tunnel is connected, open http://localhost:8000/targets in your browser to view the scrape data.
The screenshot below shows an example endpoint containing report ID 153, with State: UNKNOWN and Last Scrape: Never; its Error column is blank. That image alone does not establish that report 153 is missing. Compare the endpoint with your actual report ID and inspect the result after a scrape has occurred.
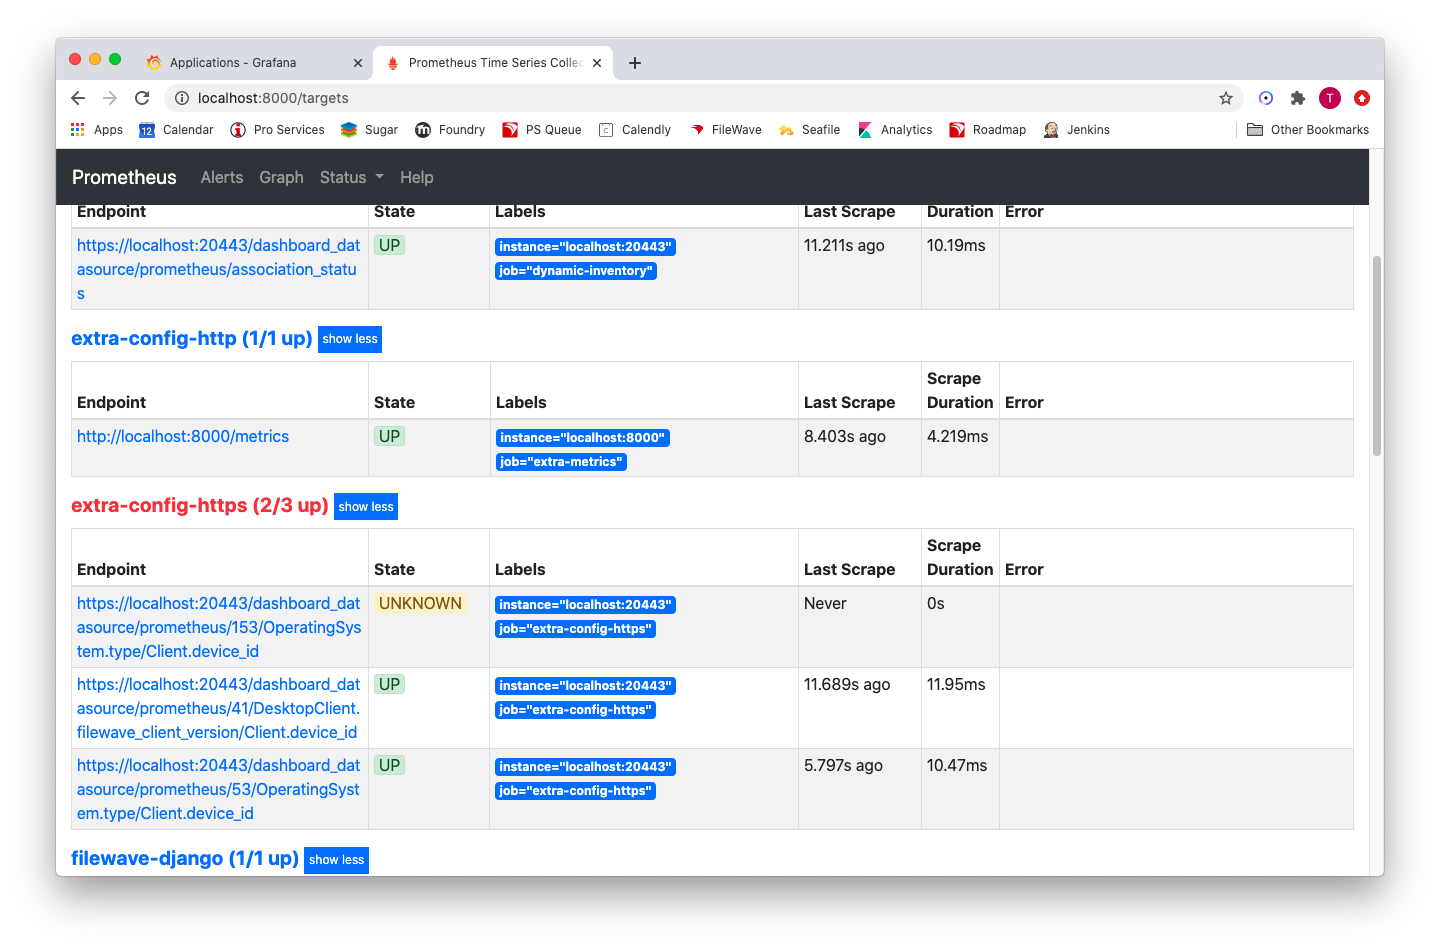
Interpret the result
- Target missing: Check that the custom YAML job is in /usr/local/etc/filewave/prometheus/conf.d/jobs/https on the Server, with the intended lines enabled and valid YAML indentation. Allow a minute or two for the job to be read.
- Target present but failing: Read the reported error and confirm that the referenced Inventory Report exists and includes the counting and grouping fields. If authentication started failing after an API-key change, see YML Files not being processed; do not apply that repair to every scrape error.
- Target UP: A successful scrape does not prove the report counts the intended devices. Continue to Exploring Your New Aggregate Data and compare the metric with the source report before building a panel.
Keep the SSH session open while using the local targets page, then close it when finished. Do not open the Prometheus port to external access just to perform this check.
No comments to display
No comments to display