Configuring and using the Dashboard
In FileWave Central, the Dashboard is the first view an administrator gets of their FileWave environment. The Dashboard is designed to give the FileWave administrators a quick view of their server and be able to focus in on a missing setting, or a possible service interruption. There are seven major sections on the Dashboard.
Primary Services
This section shows the major services - DEP, VPP, Email, etc with last update and, if there is an error, a direct link to the settings that can address that error.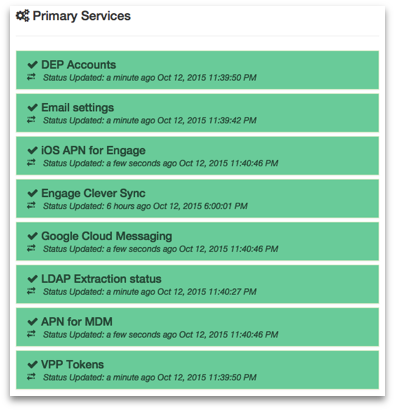
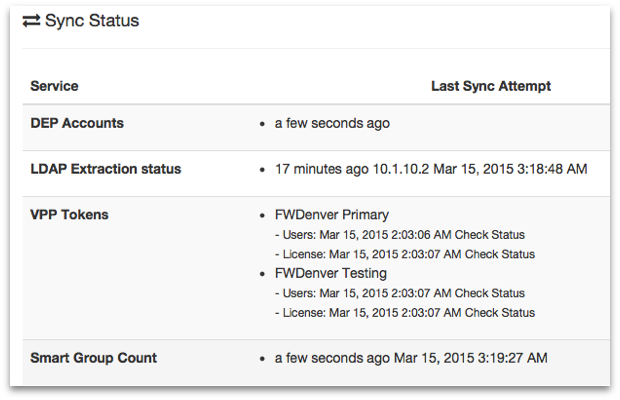
Sync Status
This section shows the latest 'check-in' times for certain services, such as VPP, DEP, LDAP, and Smart Groups. These services all have preferences requiring synchronization between a remote service, for example your LDAP server, and the FileWave server.
Server Performance Status
This section is an active chart of the status of the primary FileWave server's storage space, CPU usage, and RAM utilization.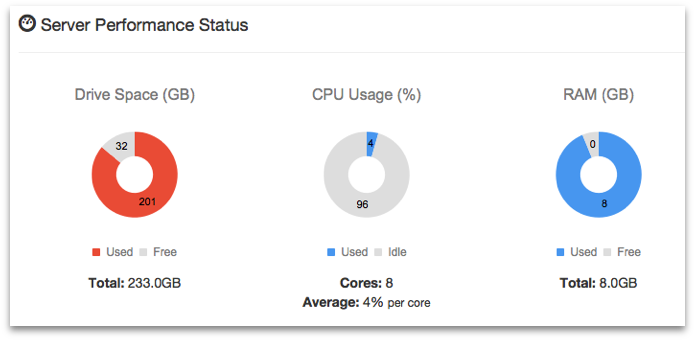
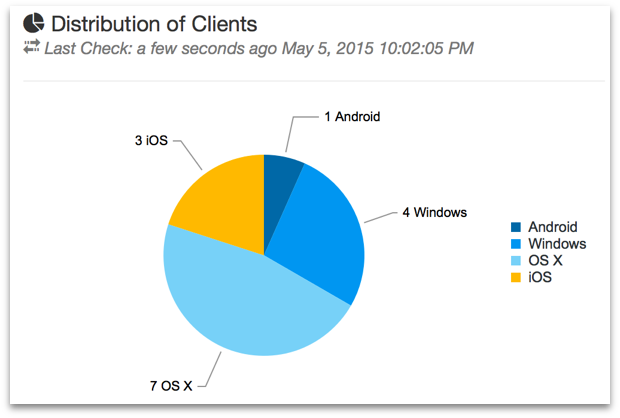
Distribution of clients
This section displays a graph showing the breakdown of FileWave clients based on operating system.
Mail Queue
This section displays a running graph of the status of emails sent from the FileWave server. The focus will be on the VPP / MDM invitation emails. This will help you see situations where your local email server may be getting overwhelmed by the large number of MDM invitations going out at the same time.
Enterprise IPA URL Check
This section shows the validity of your institutionally created iOS apps as well as the enterprise apps provided by FileWave (iOS App Portal / Kiosk).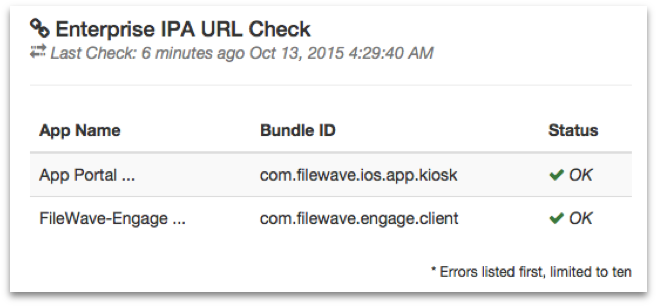
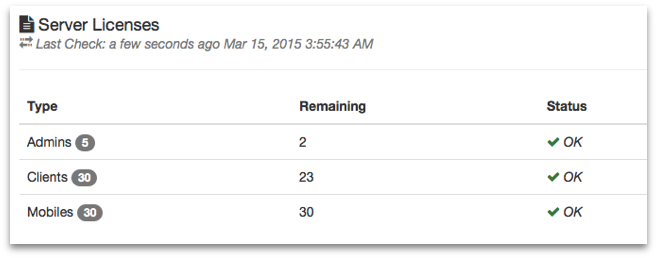
Server Licenses
This section shows the current status of your FileWave server license.
Alert Settings
The Dashboard provides FileWave Central with the ability send notifications out to individuals at status changes on the server. You toggle between the Alert Settings and the Dashboard in order to configure the types of alerts sent out and who they are sent to.
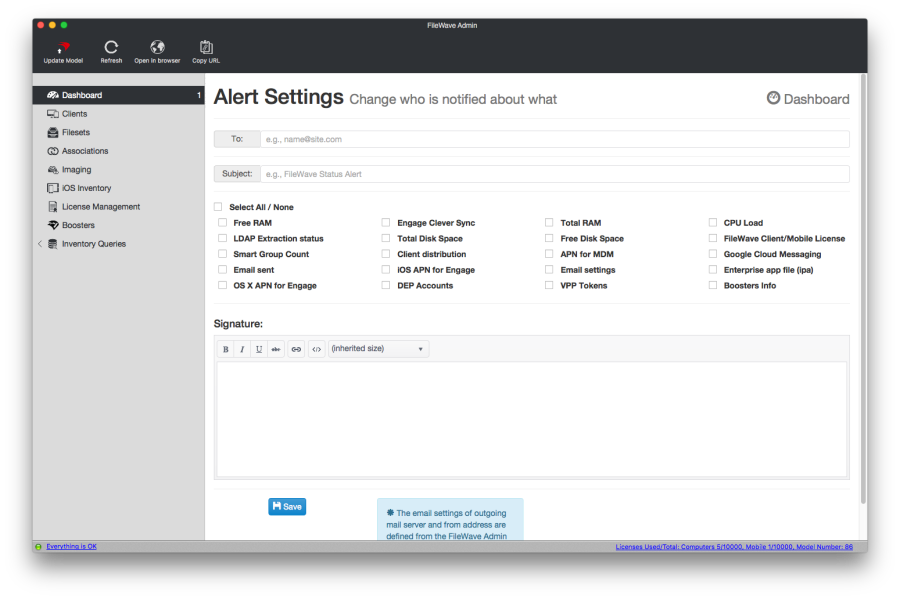
The result is an email when an event is triggered being sent to the designated email account.
"Detachable" Dashboard
The Dashboard is part of the FileWave Central application; but it can also be dragged off to be viewed as a separate window on the administrator's computer, opened in a browser, or provided as a URL to other interested parties to view on their own computers or devices.
Dashboard Alert details
A table with explanations of all of the available alert items from the Dashboard is available in the Dashboard Warning levels and Descriptions KB.
No comments to display
No comments to display