Client Monitor (16.0+)
What
The FileWave Client Monitor is a tool that provides administrators with real-time insights into device connectivity and status. It helps diagnose and resolve issues efficiently, ensuring seamless communication between clients and the FileWave server. FileWave 16.0 introduces a major upgrade with a streamlined interface, improved Network Address Translation (NAT) compatibility, and enhanced security features.
With these improvements, there is no longer a "Client Preferences" password used or needed to be able to use the new v.16+ Client Monitor with any FileWave managed devices that are running v.16+ of the FileWave Client.
When/Why
Use the Client Monitor to monitor and troubleshoot device connectivity, whether on local networks or remote environments. The enhancements in FileWave 16.0 improve:
-
NAT Compatibility – Visibility into devices across remote networks without additional configuration.
-
Security – Strengthened authentication and encryption for safer device management.
-
User Interface – A modernized layout for easier navigation and usability.
-
Troubleshooting – Detailed logs and insights for faster issue resolution.
Note that although the standalone Client Monitor app is included with 16.0.0+ Admin installs, it is only functional for monitoring macOS and Windows clients running less than FileWave Client 16.0.0, but it also still is used to monitor a FileWave IVS for Windows Imaging as of 16.0.x. The old Client Monitor app will eventually be removed in a future version.
How
Before you try to use Client Monitor it's important to understand how access to it is controlled. Below is an image of the permissions in a FileWave Server. "Modify Clients/Groups" is the relevant permission. If you do not have this permission then you will only be able to monitor a client, and will not be able to make settings changes. If you do have this permission then you will be able to make settings changes.
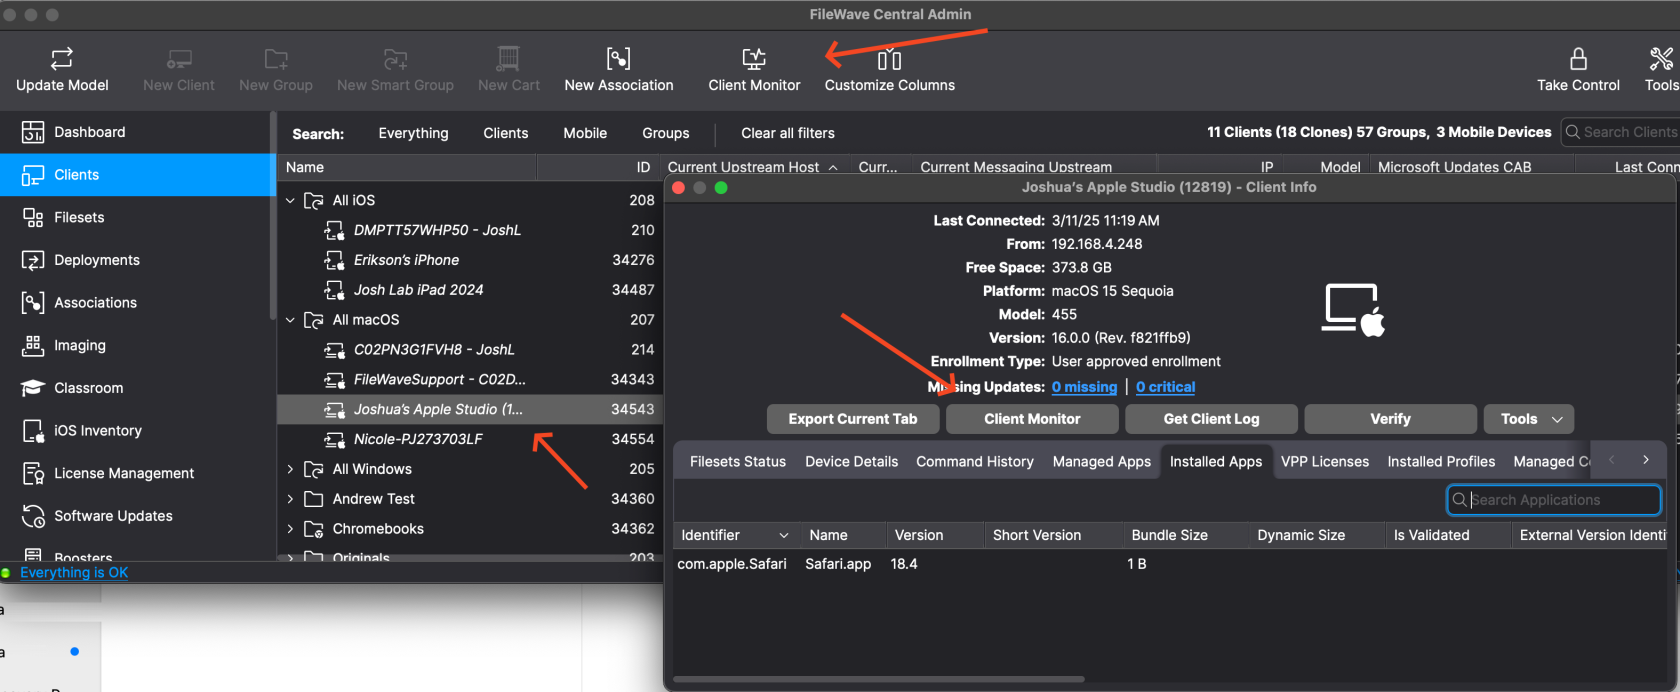
You can access Client Monitor from both FileWave Central as well as FileWave Anywhere. In FileWave Central you can either use the "Client Monitor" button in the toolbar or the button when looking at Client Info.
It should be noted that the new Client Monitor in 16.0+ can not monitor an earlier macOS or Windows client. For this reason we still include the standalone version of Client Monitor that is installed with FileWave Central. You can still use that to monitor an older client.
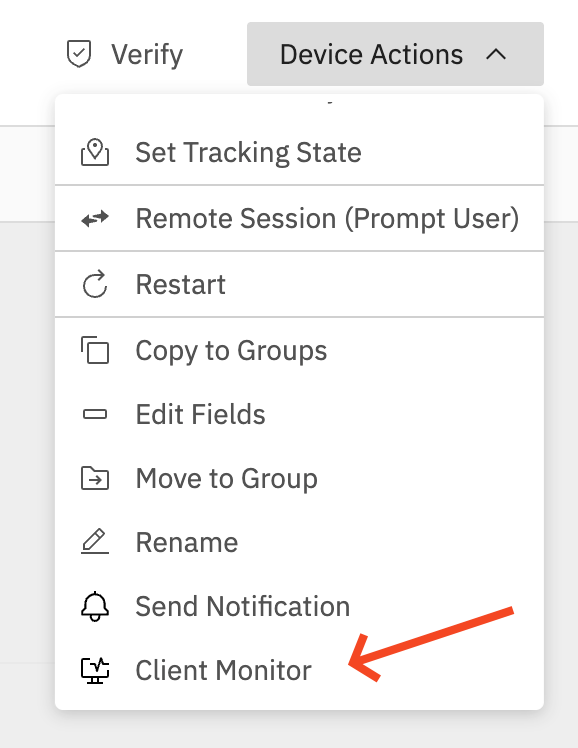
 In FileWave Anywhere you can select a client and then pick the "Client Monitor" button. In FileWave Anywhere you can also use the Device Actions menu when viewing a device to launch it. Both methods provide quick access to the Client Monitor.
Now that the Client Monitor is open, you might be wondering how many computers you can monitor simultaneously. FileWave supports monitoring up to 50 devices at once, which should be more than enough for most use cases. However, if you regularly need to monitor more than 50 devices at the same time, let us know!
The Client Monitor has two main tabs—let’s take a closer look below.
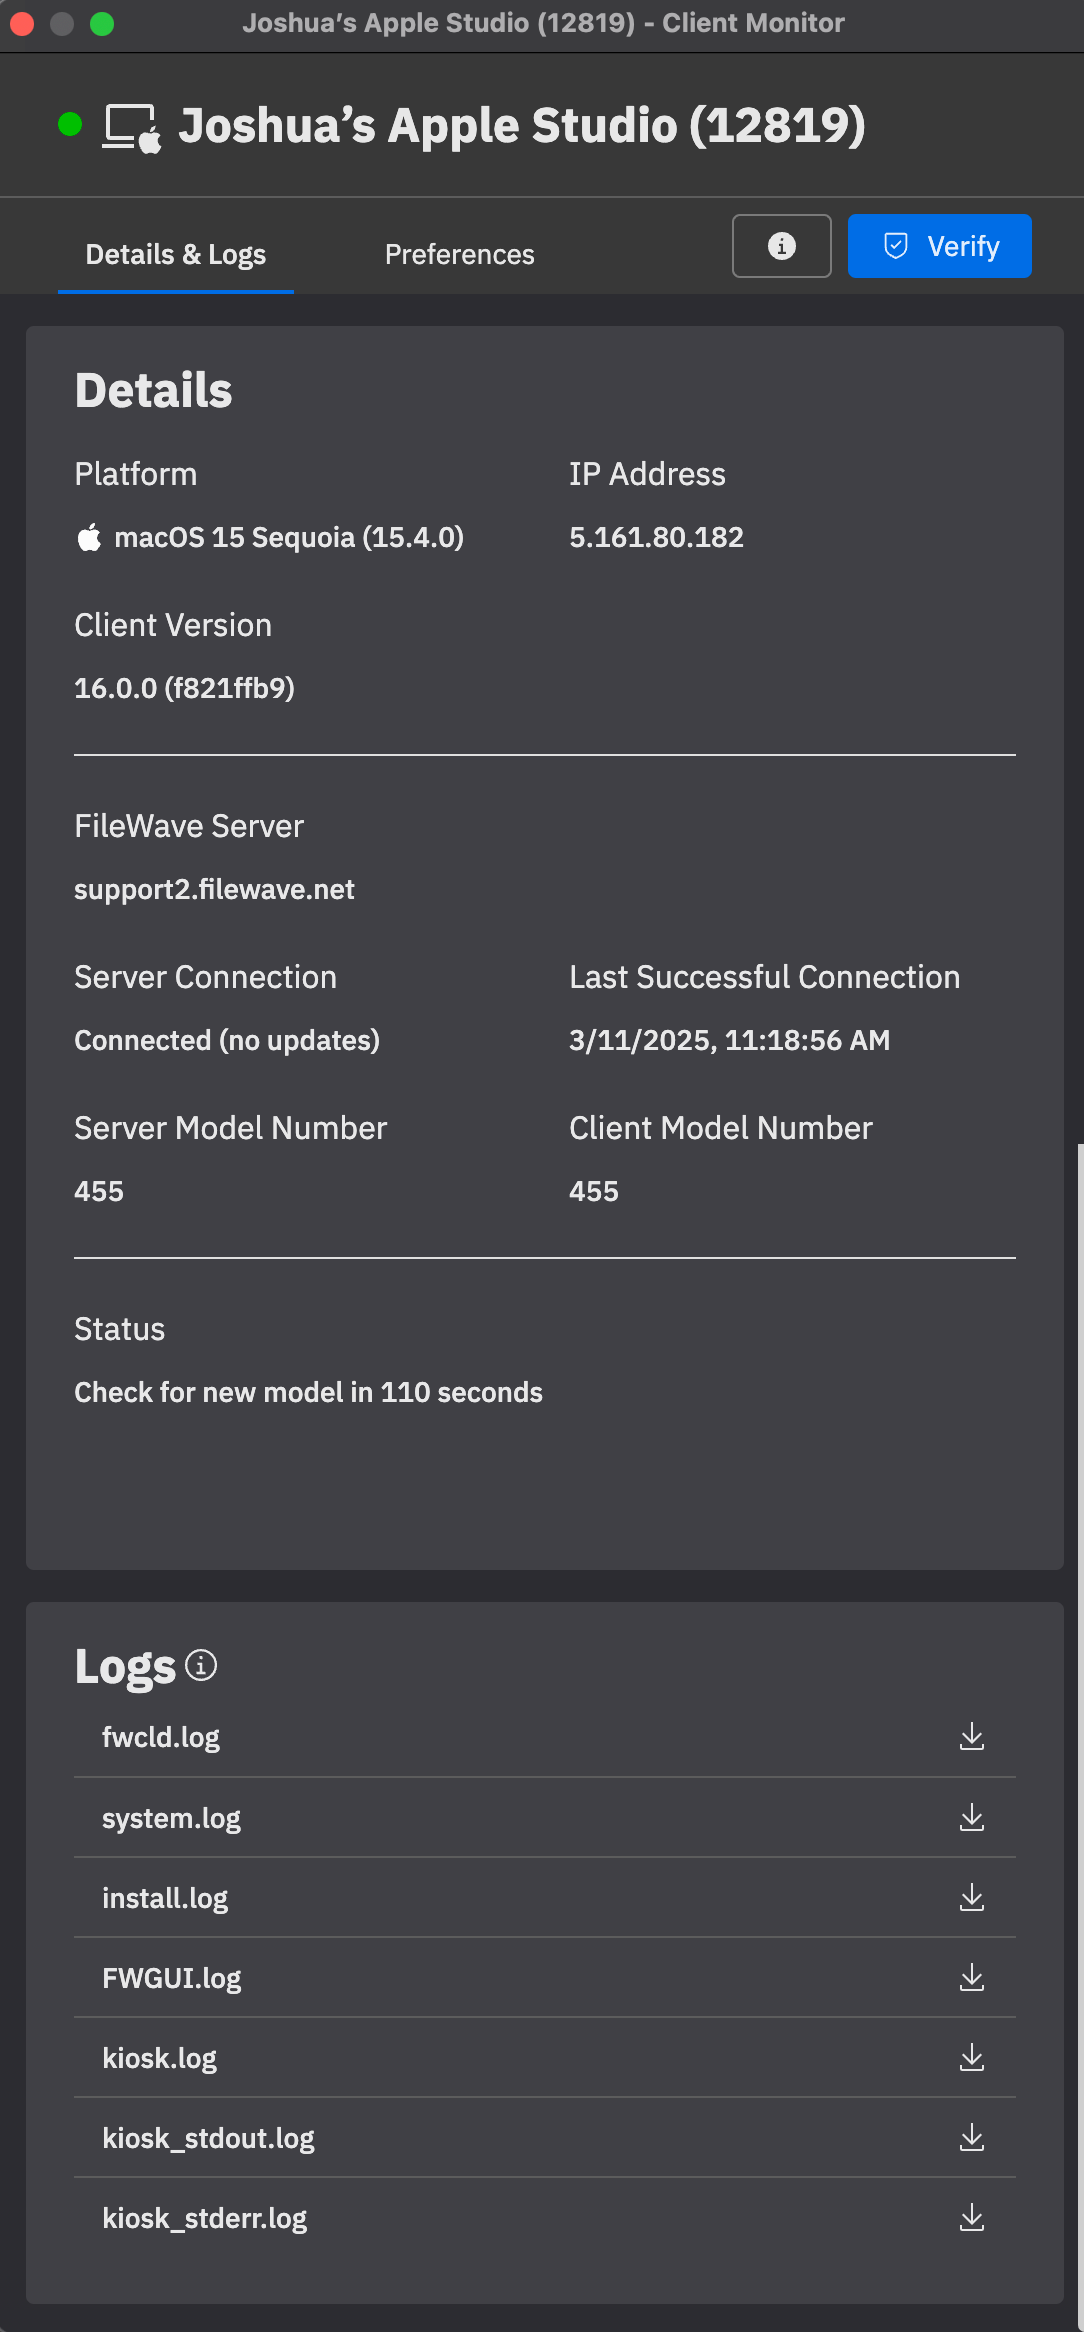
Details & LogsThis tab provides real-time information about how the FileWave Client is performing on macOS or Windows devices. One of the biggest improvements in the new Client Monitor is its use of a NATS connection, allowing you to monitor devices even if they are on a different network. This eliminates the need to manually enter an IP address and removes the limitation of only monitoring devices you can directly connect to within your local network.
Key features in this tab:
|
|
Preferences
This tab simplifies altering/setting the client settings. We’ve streamlined this section to make adjustments more intuitive and effective.
Key settings include:
|


No comments to display
No comments to display